

Purpose of the Indicator
Pro-Setups: Base Detector is designed to automatically identify and display consolidation bases that form in the price movement of a stock.
What is a Base?
A base is a period during which a stock consolidates within a price range, often following an earlier advance. During this period, the stock may absorb selling pressure, establish support, and prepare for its next significant price movement.
Identifying such formations manually can be time-consuming. Pro-Setups: Base Detector indicator simplifies this process by identifying bases drawing their boundaries directly on the price chart, and displaying their length, depth, and pivot level.
The idea is to help traders understand where a stock is consolidating, how long the consolidation has lasted, how deep the correction has been, and which price level may become important for a potential breakout.
Understanding the Three Types of Bases
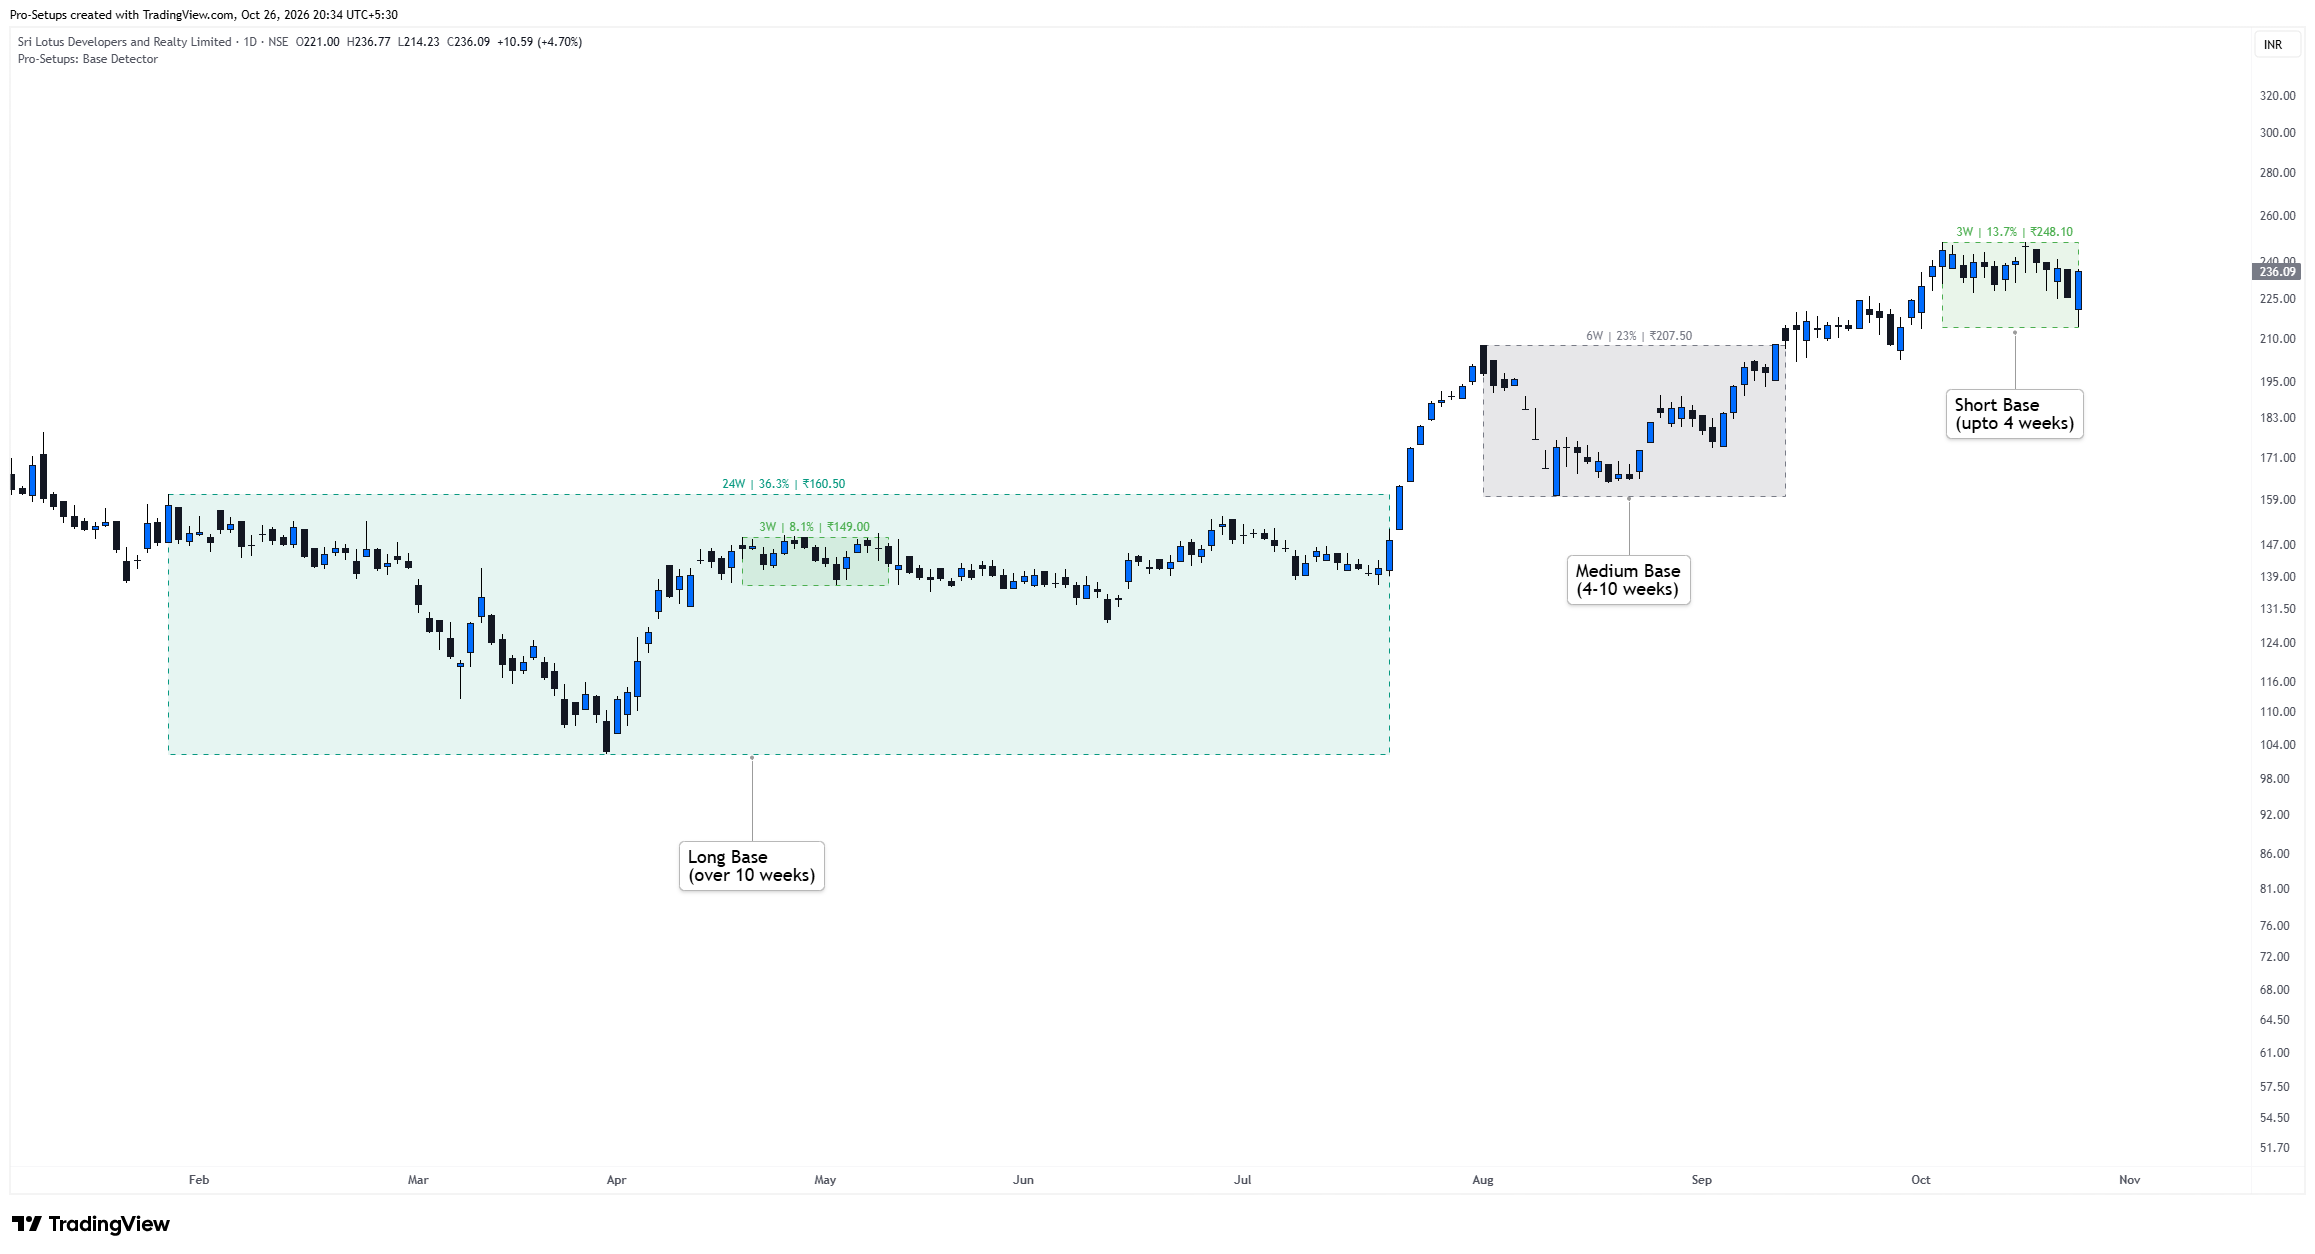
1. Short Base
Short Bases represent relatively brief periods of consolidation. They can help identify stocks that are taking a relatively short pause after an advance or developing a tighter price structure.
The indicator initially identifies these formations over approximately 2-4 weeks, subject to a maximum base depth of 20%.
A Short Base may be particularly useful for observing stocks that are already demonstrating strength and are consolidating without requiring a lengthy correction.
Default Colour: Green
2. Medium Base
Medium Bases represent consolidations developing over a longer period. These formations allow traders to observe stocks undergoing a more extended period of price digestion.
The indicator initially identifies these formations over approximately 4-10 weeks, subject to a maximum base depth of 30%.
A Medium Base may develop independently or emerge when an existing Short Base continues to consolidate.
Default Colour: Grey
3. Long Base
Long Bases represent more extended consolidation structures. They can help identify stocks that have spent several months consolidating, including those attempting to establish a new price structure following a substantial correction.
The indicator initially identifies these formations over 10 weeks, subject to a maximum base depth of 60%.
A Long Base may develop independently or emerge when an existing Medium Base continues to extend.
Default Colour: Teal
Note: The above periods describe the initial identification ranges. An already identified Long Base can continue to develop if its price structure remains valid. The permitted depths are detection limits, not measures of base quality.
Understanding the Base Box
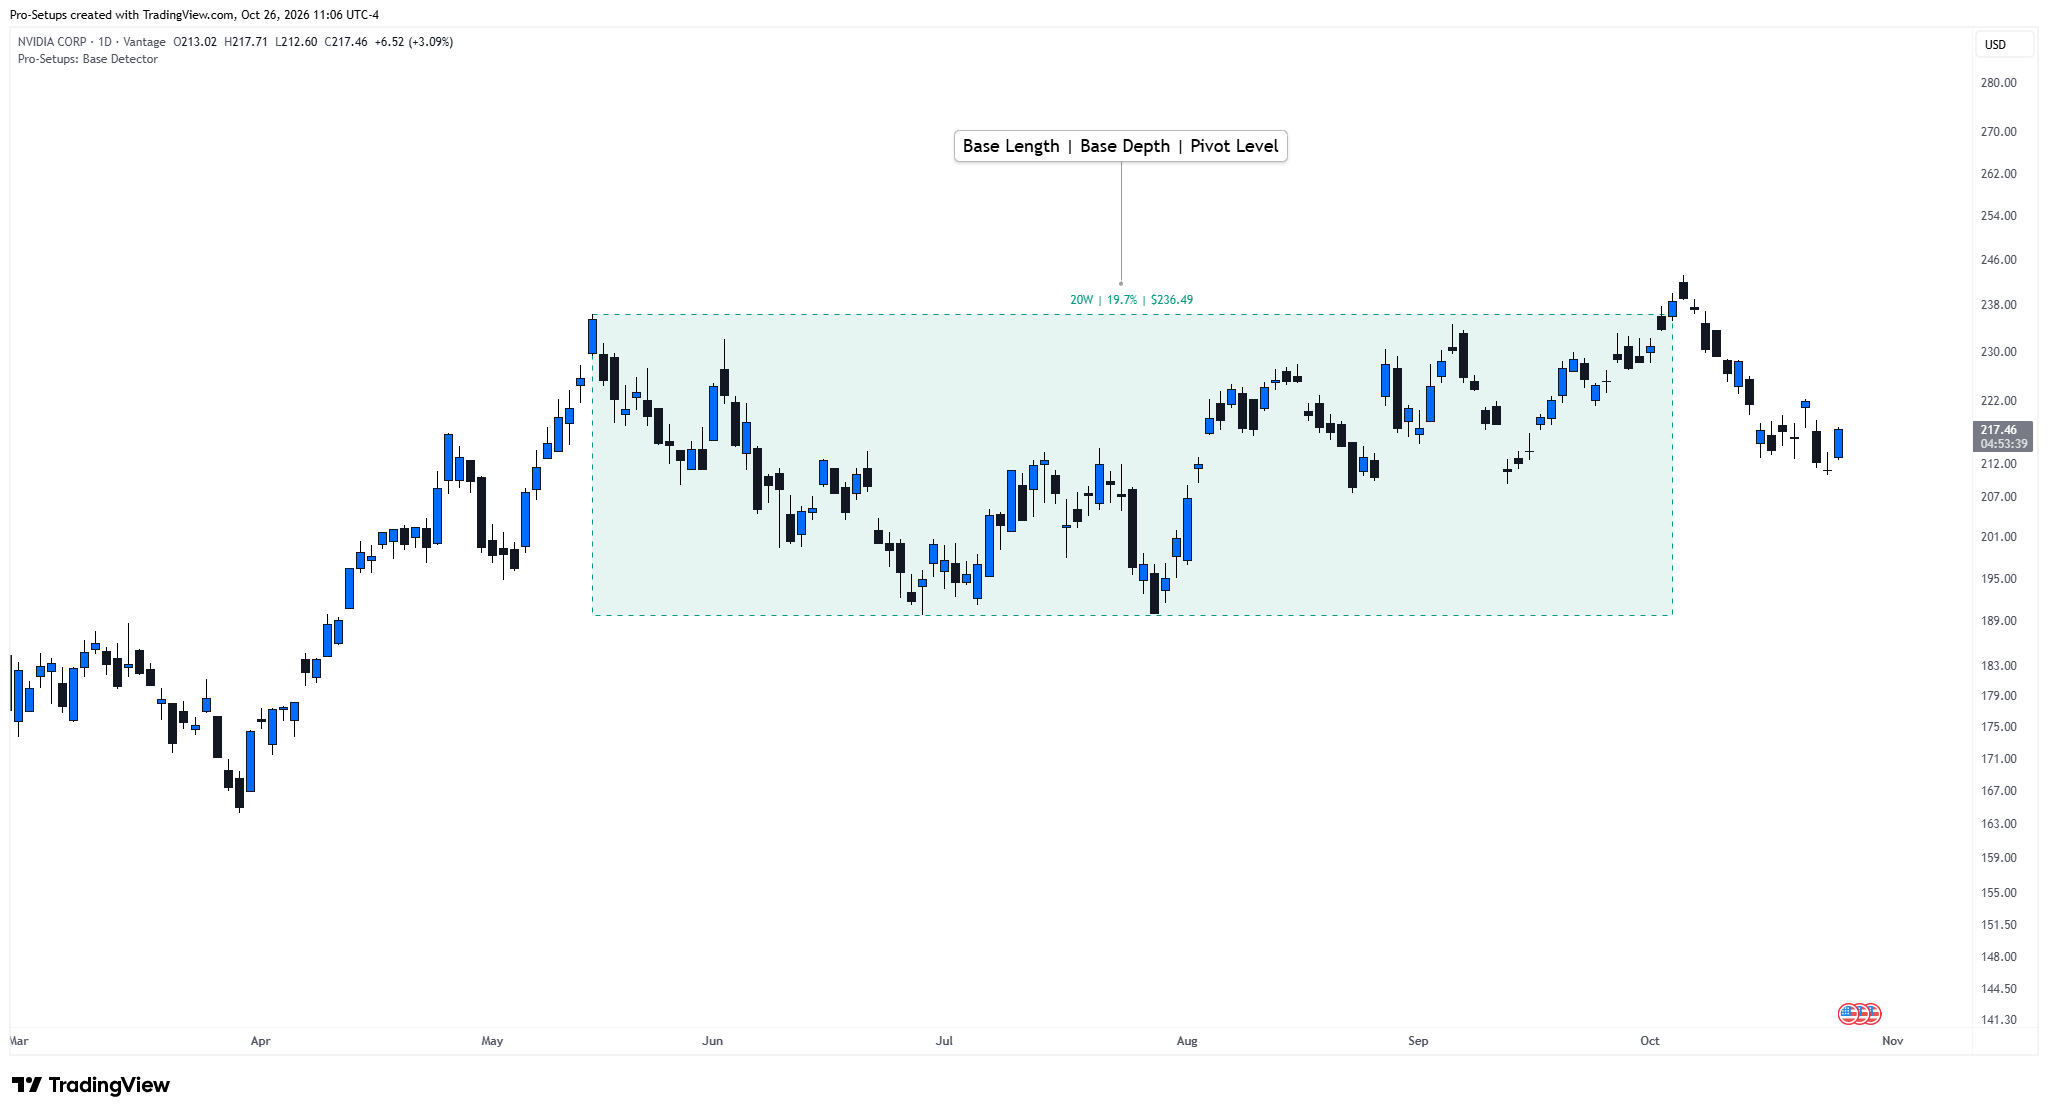
Each identified base is displayed as a shaded box on the price chart. The box provides a visual representation of the consolidation range, while the label above it summarises three important characteristics:
1. Base Length
Base Length represents how long the stock has been consolidating. It is displayed in approximate trading weeks, using five trading days per week.
Shorter consolidations may indicate that a stock is taking a brief pause after its previous price movement. Medium-length consolidations may indicate that a stock is spending more time absorbing supply and building a stronger foundation for its next move. Longer consolidations may indicate that a stock has spent more time digesting its previous price movement.
2. Base Depth
Base Depth measures the percentage decline from the base upper reference level to its lowest price. It helps traders assess how much the stock has corrected during the consolidation. For example, a base with a pivot of $500 and a low of $450 would have a depth of 10%.
Shallower bases may indicate tighter price action, while deeper bases reflect greater price volatility or correction.
3. Pivot Level
The Pivot Level represents the upper reference price of the identified base, established from its starting high. It is an important level to monitor because a move above it may indicate that the stock is attempting to emerge from its consolidation. For example, if a stock is forming a base with a pivot of $500, traders can observe how price behaves as it approaches and potentially moves above $500. The indicator displays this price in the stock’s trading currency.
4. Higher-High Poke and Breakout Cushion
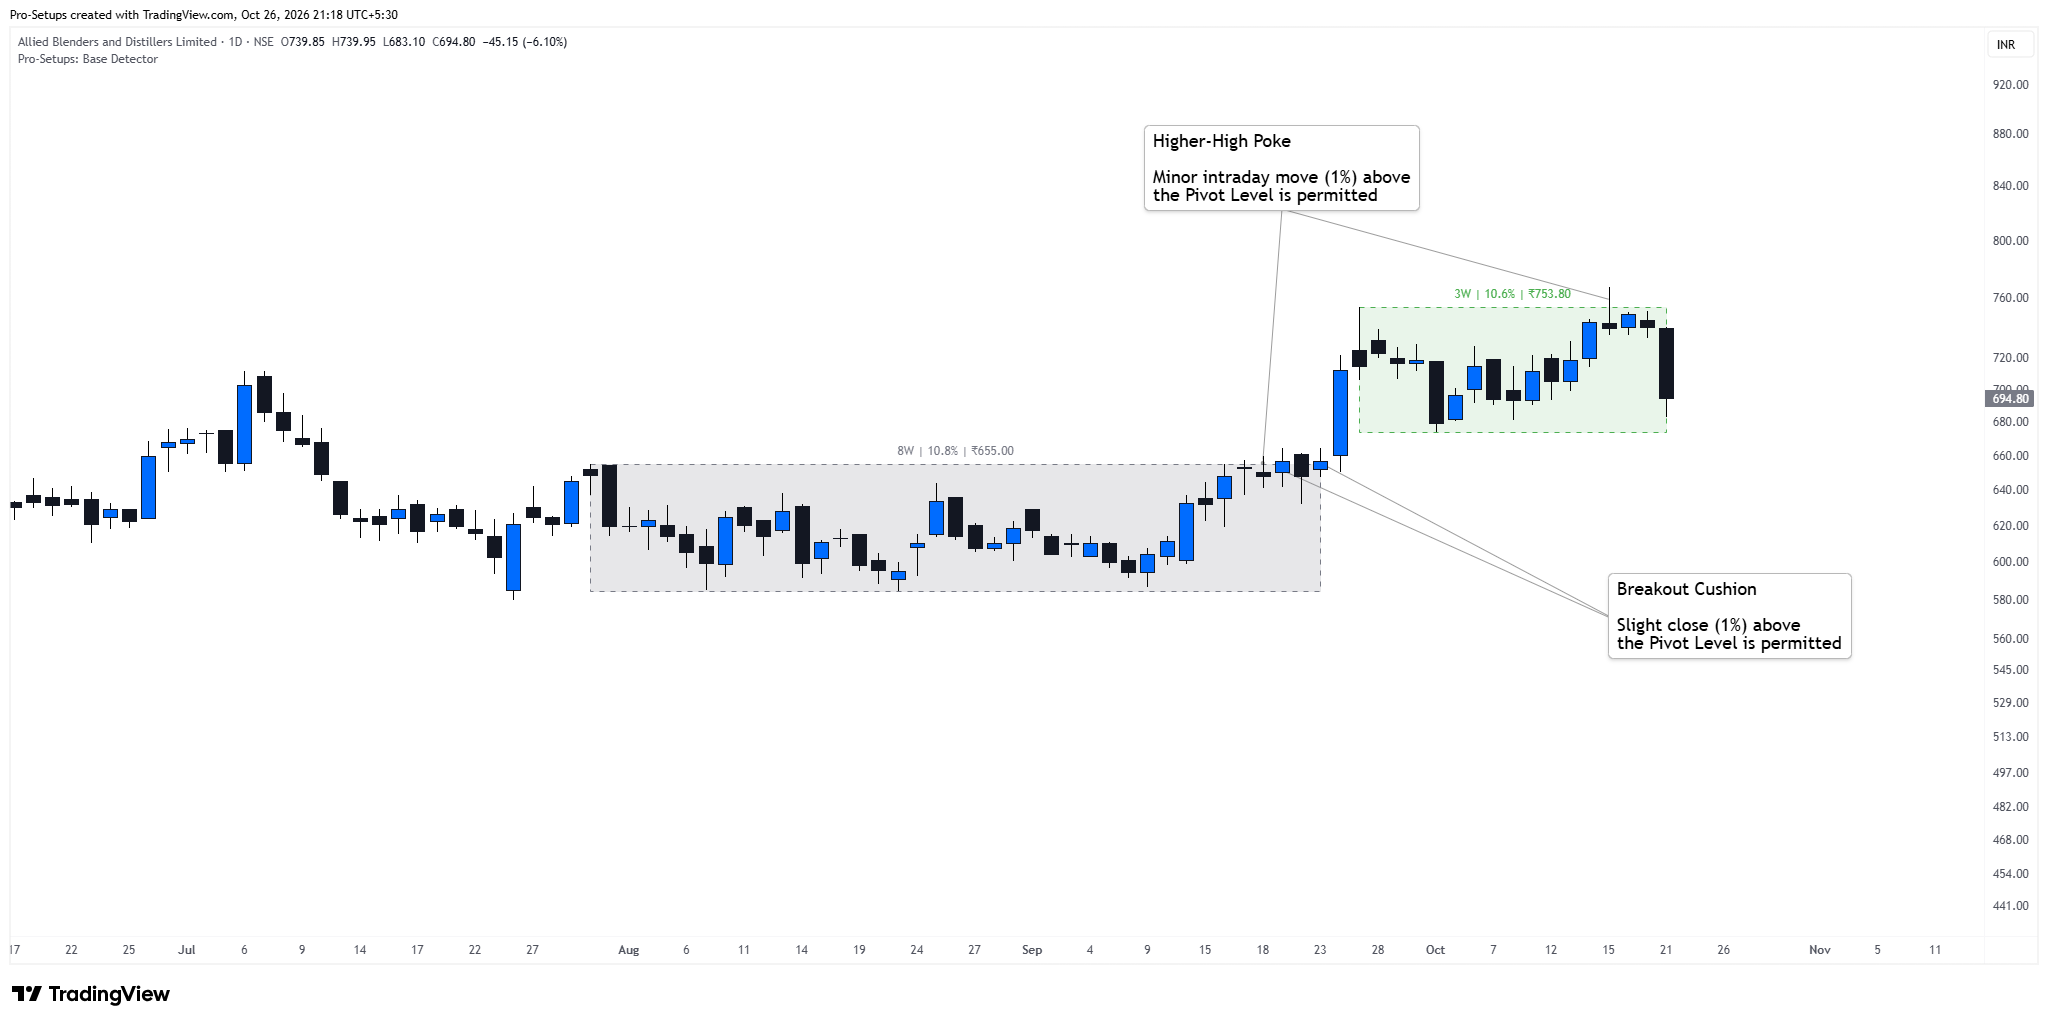
The indicator allows some flexibility around the Pivot Level to accommodate minor price fluctuations without prematurely invalidating a consolidation.
Higher-High Poke (1%): During the initial identification of a base, the indicator permits individual candles to make highs up to 1% above the Pivot Level. This accommodates minor price fluctuations without rejecting an otherwise valid consolidation.
For example, if a base has a Pivot Level of $500, a candle reaching an intraday high of $503 may still be considered part of the base, provided the movement remains within the permitted allowance and other conditions are satisfied.
Breakout Cushion (1%): Once a base is identified, the indicator allows the closing price to move up to 1% above the Pivot Level while the base continues to develop. If the closing price exceeds this cushion, the existing base is considered to have ended.
For example, if a base has a Pivot Level of $500, the indicator allows a 1% cushion up to $505. A close at or below $505 may allow the base to remain active, provided its other conditions are satisfied.
During the continuation of an active base, an intraday high above the 1% threshold may also be tolerated if the closing price remains within the permitted cushion.
These allowances help prevent minor movements around the Pivot Level from prematurely invalidating a consolidation.
Dynamic Base Development
As new trading sessions develop, the indicator continuously evaluates whether an existing base remains valid. If the consolidation continues, the box can extend to include additional trading sessions, and its length or depth may change. A Short Base may eventually become a Medium Base, and a Medium Base may develop into a Long Base, provided the relevant conditions remain satisfied. The indicator automatically updates the base category, box colour, and displayed information over the box when such a transition occurs.
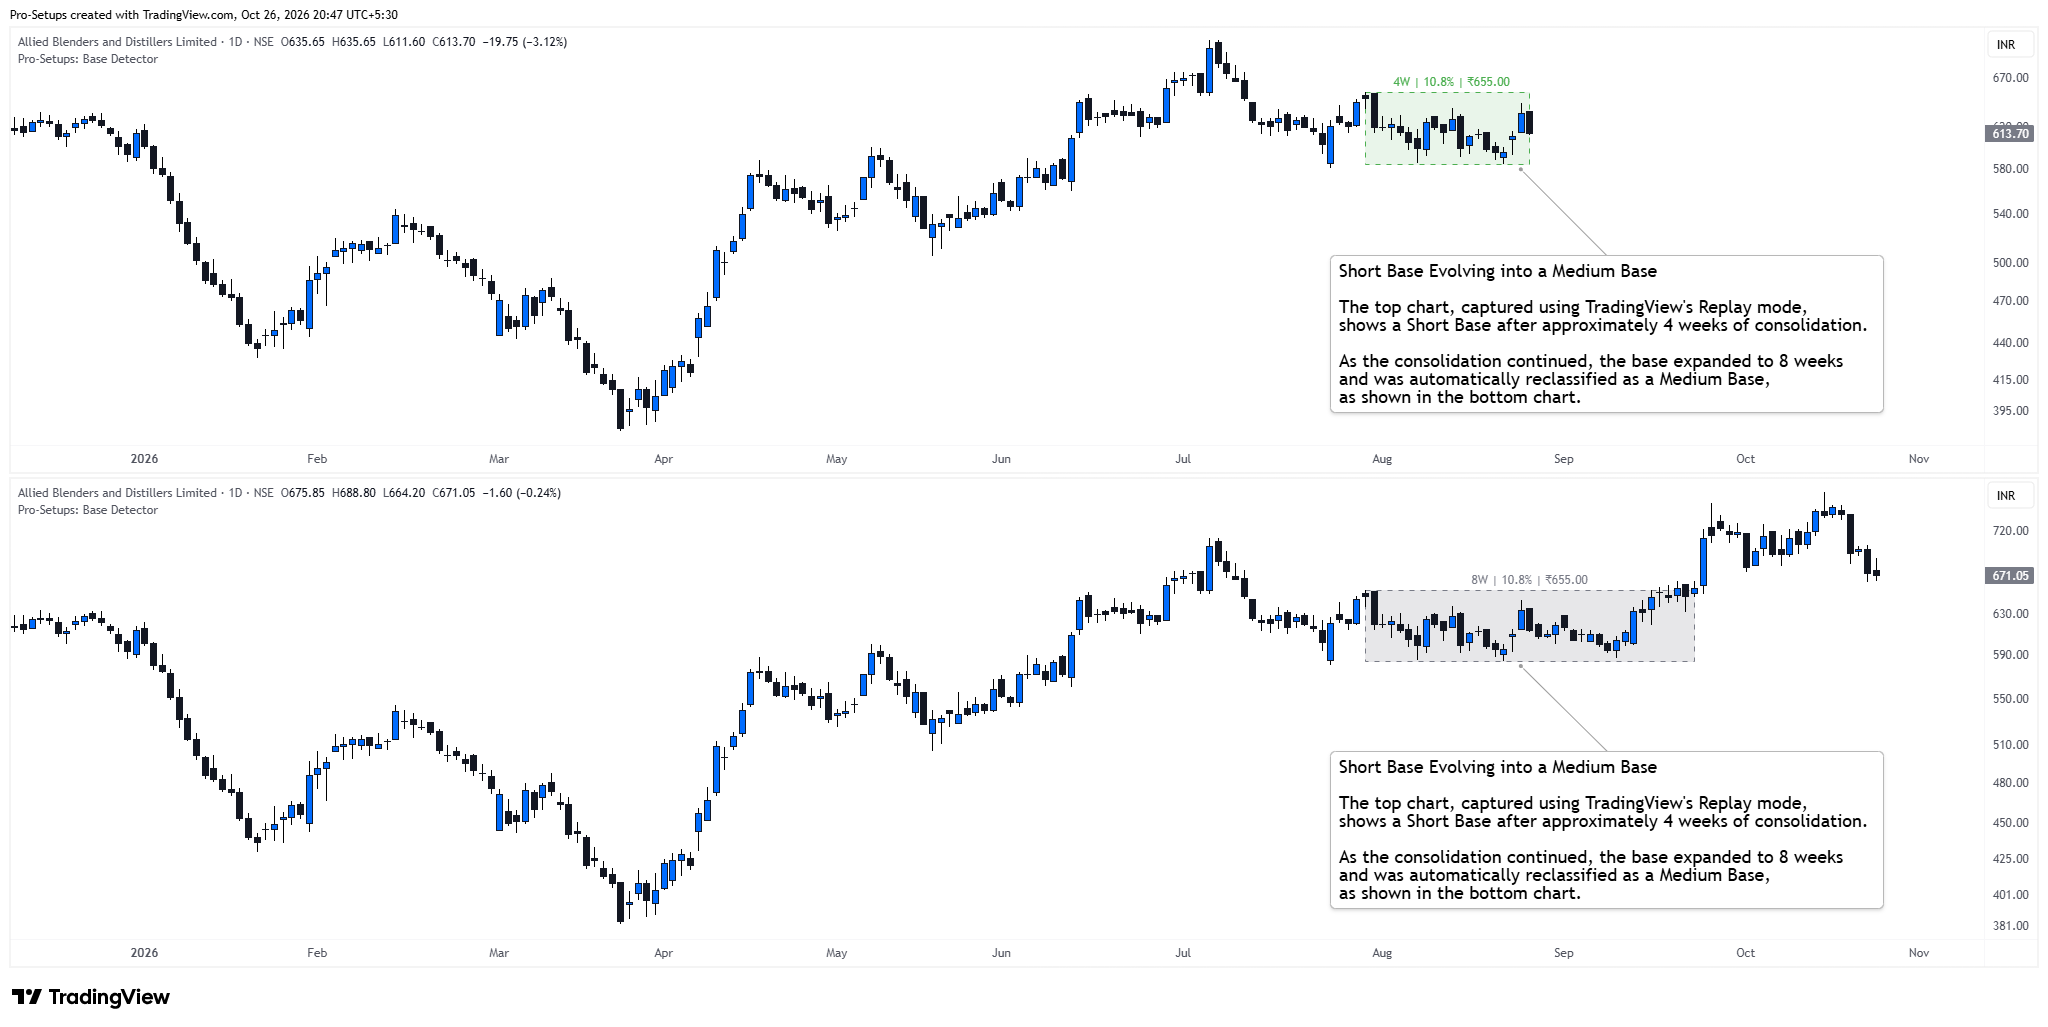
This allows traders to follow the evolution of a consolidation without having to redraw its boundaries manually.
Overlapping Bases
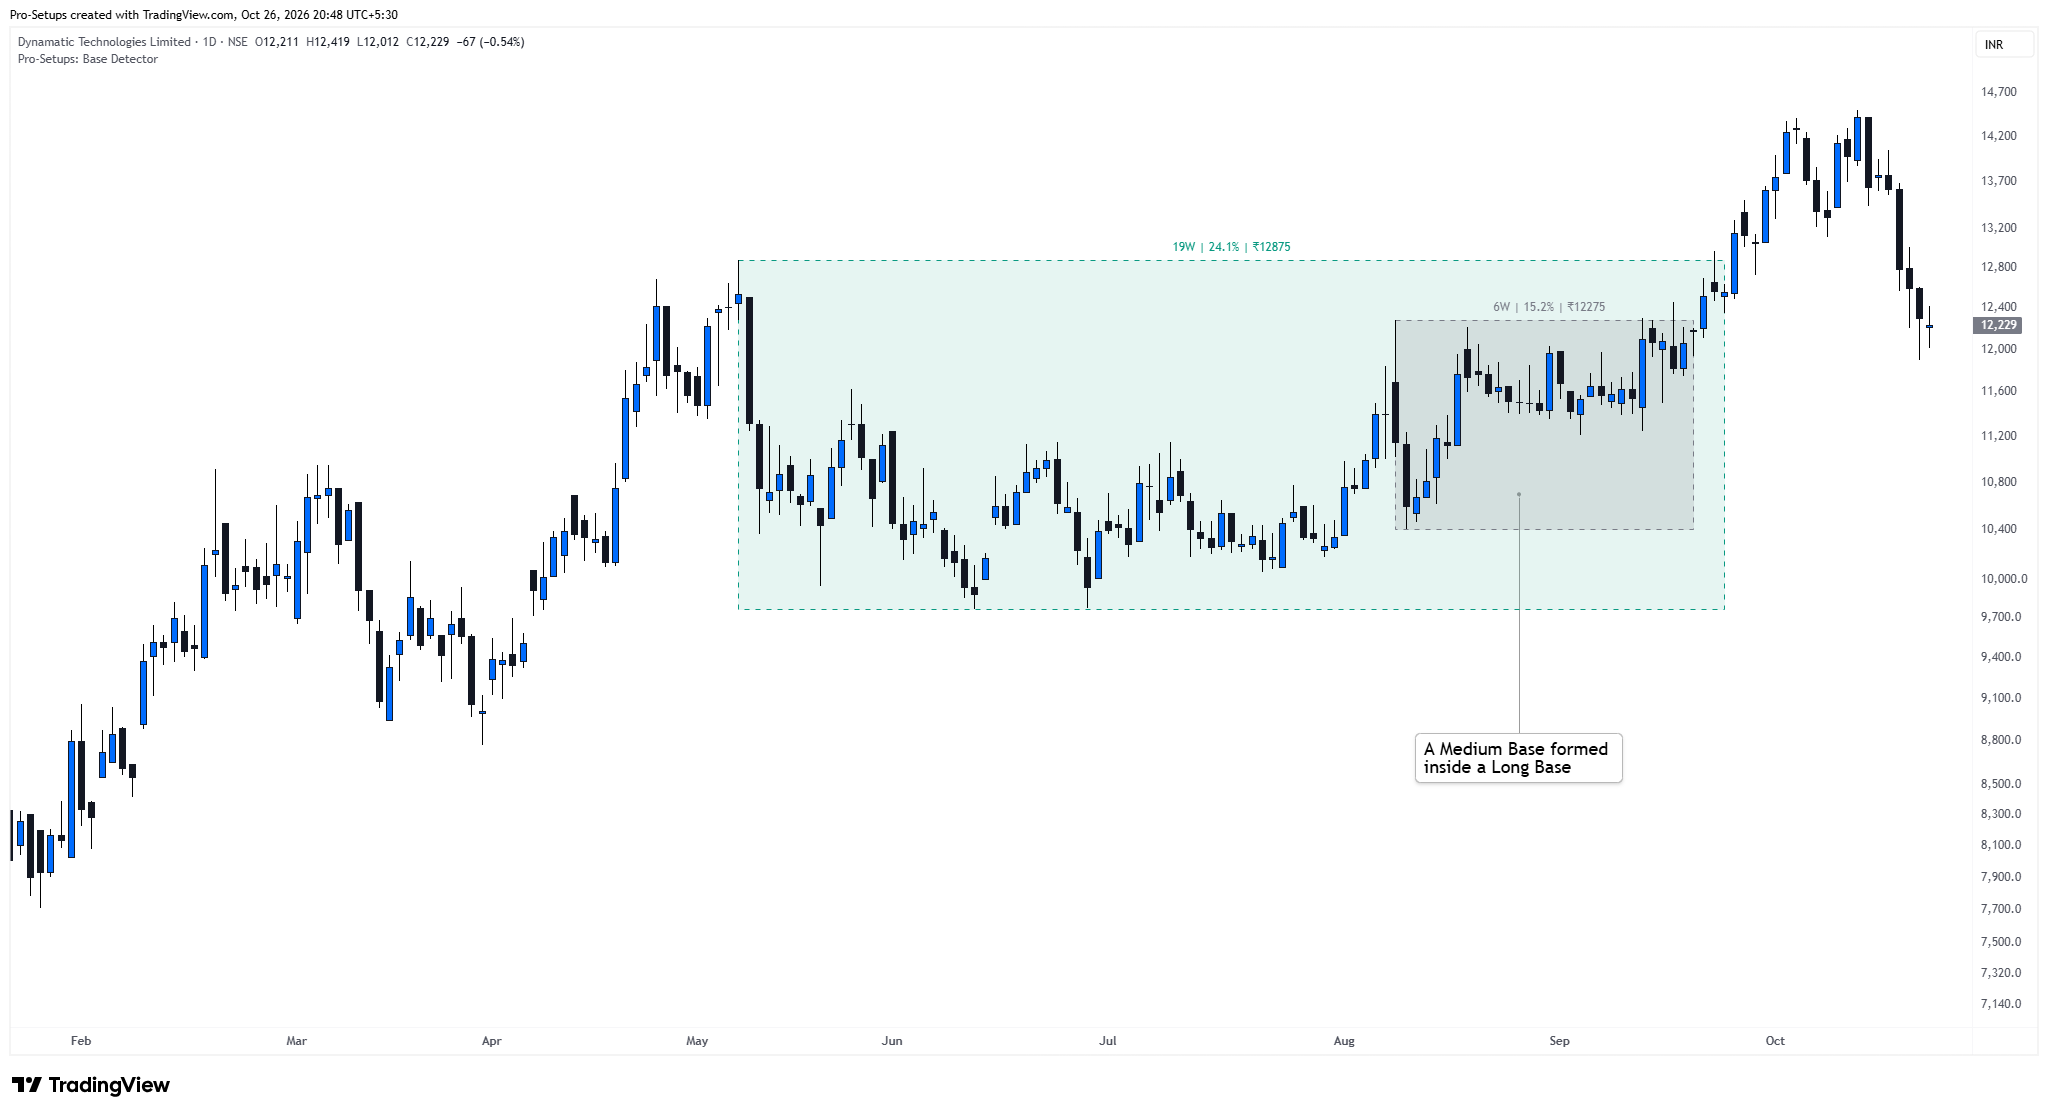
Stocks do not always consolidate in one clearly defined structure. A shorter consolidation may develop inside a larger base. The indicator recognises such formations and allows meaningful bases of different categories to coexist. For example, a Short Base may appear inside a Medium or Long Base, while a Medium Base may develop within a Long Base.
Display Settings and Customisation
The indicator provides several settings to help traders customise the chart.
Base Display
Three display modes are available:
- Current Base Only: Displays bases that are currently forming.
- One Previous Base: Displays the current base and up to one previously completed base from each category. This is the default setting.
- All Historical Bases: Displays historical formations along with currently developing bases, subject to TradingView’s drawing limits.
Base Appearance & Information
- Short, Medium, and Long Bases can be enabled or disabled independently.
- The fill colour and border/text colour of each category can also be customised.
- The base box borders can be displayed as Solid, Dotted, or Dashed lines.
- Display of Base Length, Base Depth and Pivot Level can be enabled or disabled.
- Extending pivot level to the right - When enabled, this setting extends the pivot level horizontally to the right, making it easier to monitor the relevant price level. The extension applies only to bases currently forming on the latest candle. Completed and historical bases do not retain extended pivot lines.
How to Use Pro-Setups: Base Detector
This indicator helps traders identify price consolidations by automatically detecting Short, Medium and Long Bases based on their length and depth, while highlighting the pivot level from which a potential breakout may occur. The displayed base length, depth and pivot level help traders assess the structure and maturity of each base. By categorizing the bases depending on the duration and their depth, it helps the trader to narrow down and focus on those that are of interest to them for trading base breakouts. These features should be used alongside the broader trend, trading volume, relative strength and market conditions, rather than as standalone Buy or Sell signals.
Timeframe Behaviour
Pro-Setups: Base Detector supports Daily (1D) and Weekly (1W) charts. Base identification is performed using daily price data, including when the indicator is applied to a Weekly chart. As a result, the underlying base boundaries, pivot levels, and other base characteristics are designed to remain consistent between Daily and Weekly charts.
Other chart timeframes are not supported.
Repainting and Developing Bases
- A currently forming base is dynamic. Its box, length, depth, and classification may change as the consolidation develops.
- An identified base may also cease to qualify as active if its continuation conditions are no longer satisfied.
- Importantly, a newly identified base is drawn from the historical candle, even though the formation could only be recognised after sufficient subsequent candles had developed.
- On an unfinished daily candle, the displayed structure may change until the candle closes. Weekly charts similarly reflect the underlying developing daily data.
Important Limitations
- Pro-Setups: Base Detector is intended to help traders identify and interpret price consolidations. It is an analytical tool rather than a trading system.
- It does not predict when a breakout will occur or whether a breakout will succeed.
- Not every identified base represents institutional accumulation or a high-quality trading opportunity.
- A move above the pivot is not, by itself, confirmation of a successful breakout. It is only a reference level, not an automatic buy signal.
- Some valid chart patterns may not satisfy the indicator's detection criteria, while some identified bases may not resemble traditional textbook formations.
- The indicator should be used alongside the stock’s broader trend, volume, relative strength, and broader market analysis.
Intended Use
Pro-Setups: Base Detector is designed for traders who want a consistent, visual framework for studying consolidations across stocks. By automatically identifying Short, Medium, and Long Bases and displaying their duration, depth, and pivot levels, the indicator helps reduce the manual effort involved in analysing price structures. Its primary purpose is to make developing and historical bases easier to recognise, compare, and monitor - not to replace the trader’s judgement.
Protected Source Code
Pro-Setups: Base Detector is intended to be published as a Protected TradingView script. Under this publication method, its Pine Script source code is visible only to the author, while TradingView users can add the indicator to their charts and Favorites and use it without requiring access to the underlying code.
The source is protected because the indicator contains custom logic for identifying, validating, updating, and displaying consolidation bases, including handling overlapping formations and transitions between different base categories.
The aim is to make these analytical capabilities available to traders while protecting the underlying implementation.