

Pro-Setups: Multi-Factor Trading Toolkit
Purpose of the indicator
Pro-Setups is a chart-analysis indicator built primarily for Daily and Weekly swing and positional-trading analysis. Its purpose is to evaluate a security through four related dimensions:
Trend structure → Price/volatility contraction → Participation/volume → Relative strength
The indicator does not generate mechanical Buy or Sell recommendations.
What makes this indicator different
Pro-Setups combines several well-known technical-analysis concepts into one simple swing-trading workflow. While tools such as moving averages, Bollinger Bands, Keltner Channels, ATR and Relative Strength are commonly used on their own, Pro-Setups brings them together so that a trader can study trend, compression, volume participation, relative strength and price structure from the same chart.
The indicator also uses its own custom logic to classify Daily and Weekly trends, identify EMA-cloud compression, highlight stress in the short-term cloud, detect Fresh High Relative Volume events, track Relative Strength versus a chosen benchmark, and summarize key conditions in the Commentary panel.
The idea is simple: first understand the trend, then look for tightening or compression, check whether strong volume is present, and finally assess relative strength and price action. The individual features are therefore designed to work together as part of one chart-analysis process rather than as unrelated indicators.
The sections below explain how the main features are calculated, what they represent, and how traders may use them in practice.
1. Trend Bars
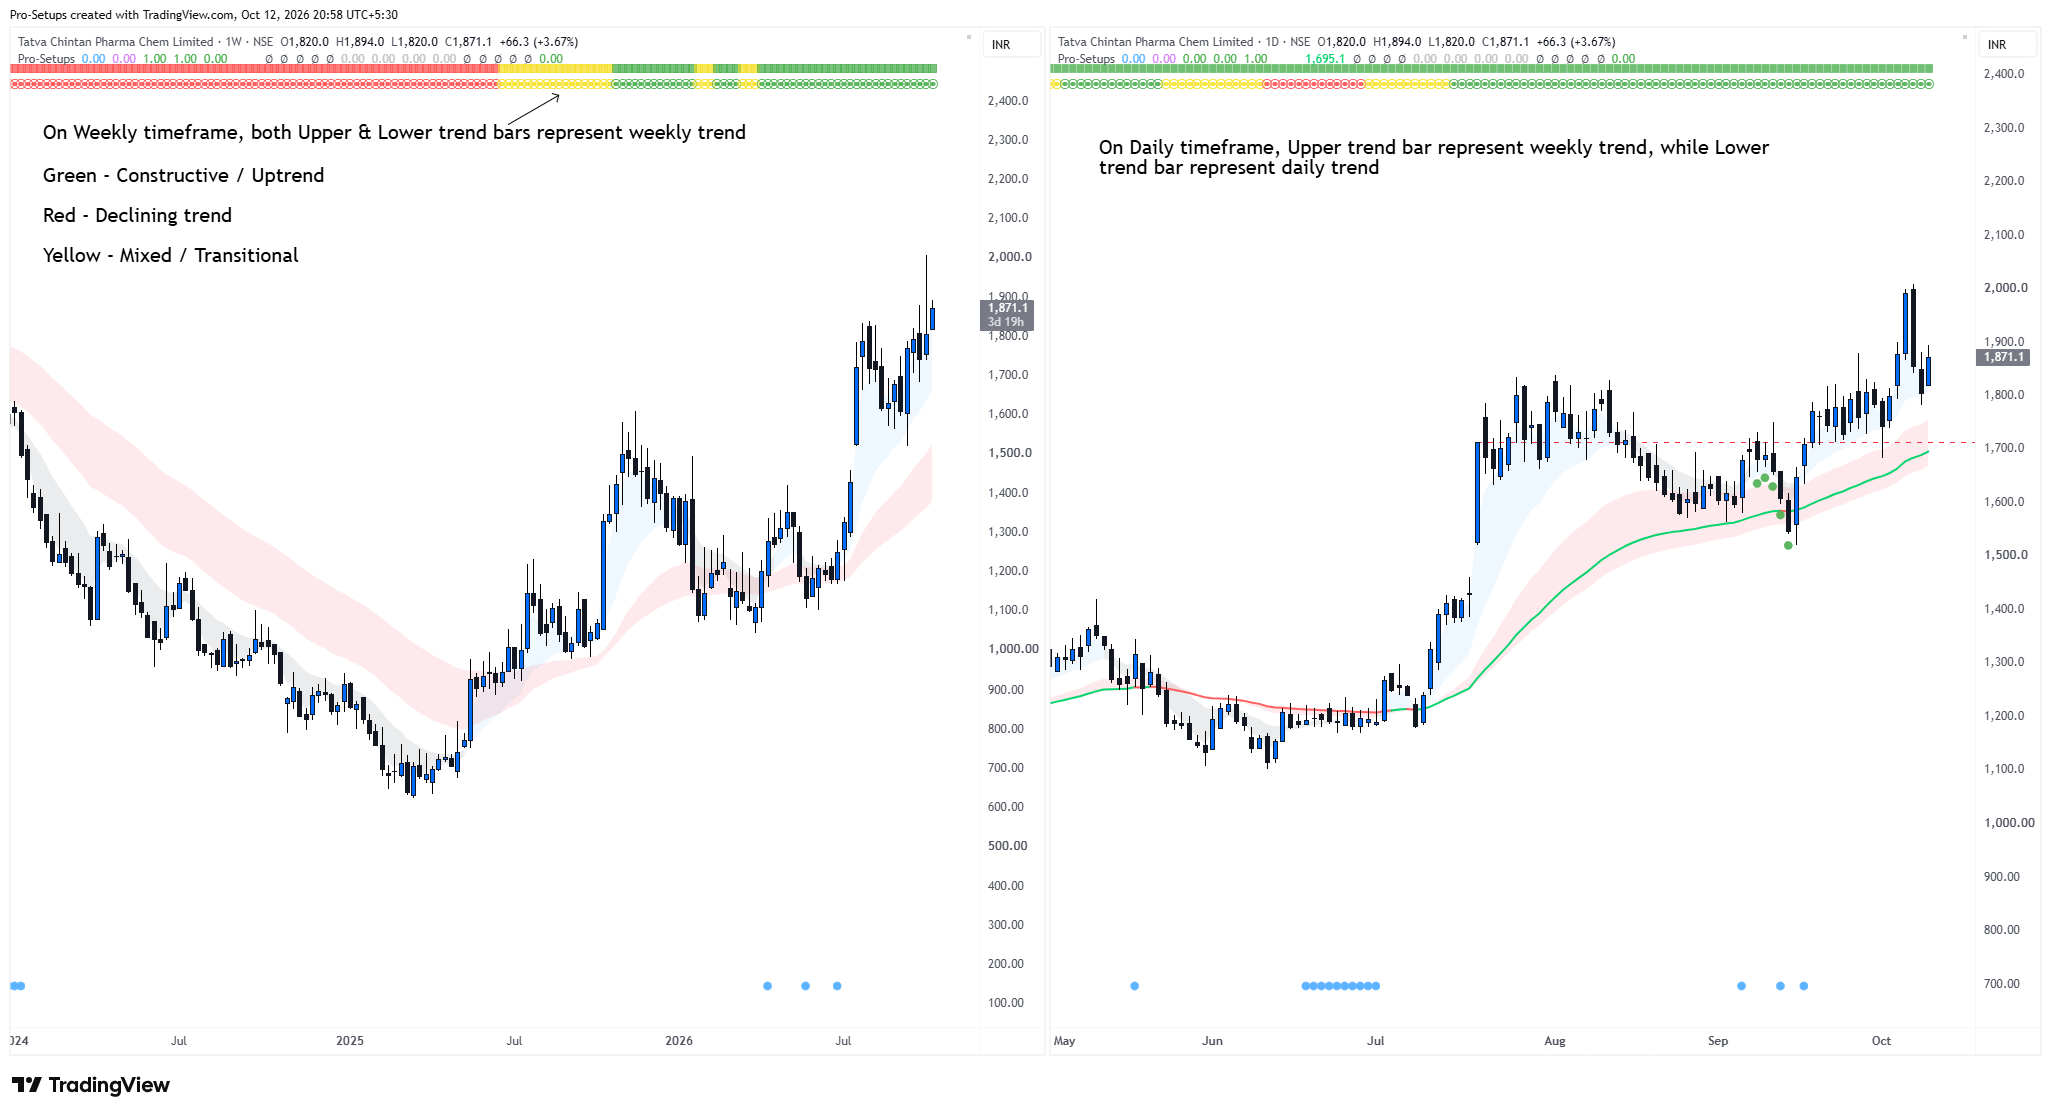
The Trend Bars give a quick view of whether the trend is constructive, declining or mixed.
On a Daily chart:
- The upper trend bar represents the Weekly trend.
- The lower trend bar represents the Daily trend.
Seeing the Weekly Trend on a Daily chart gives useful higher-timeframe context. It helps a swing trader understand whether a Daily setup is developing in the direction of the broader trend or against it. For example, a temporary Daily weakness can be viewed differently if the Weekly Trend is still constructive.
On a Weekly chart, both trend bars represent the Weekly Trend. No trend bars are displayed on timeframes lower than the Daily chart.
Green represents a constructive trend, while Red represents a declining trend. If neither Green nor Red conditions are met, the trend is classified as Yellow representing a mixed or transitional trend. These trend colors are intended as trend context and not as standalone Buy or Sell signals.
How are Trend bars’ colours identified
The indicator uses:
- Short-term EMA group: 3, 5, 8, 10 and 15 EMA
- Long-term EMA group: 30, 35, 40, 50 and 60 EMA
The indicator considers the direction and spread of the longer-duration EMA group together with the strength and positioning of the shorter-duration EMA group and price. Based on these conditions, the trend is shown as Green, Red or Yellow.
Because the current Weekly candle is still developing during the week, the Weekly Trend shown on a Daily chart may change until the Weekly candle closes.
2. Short-Term and Long-Term EMA Clouds
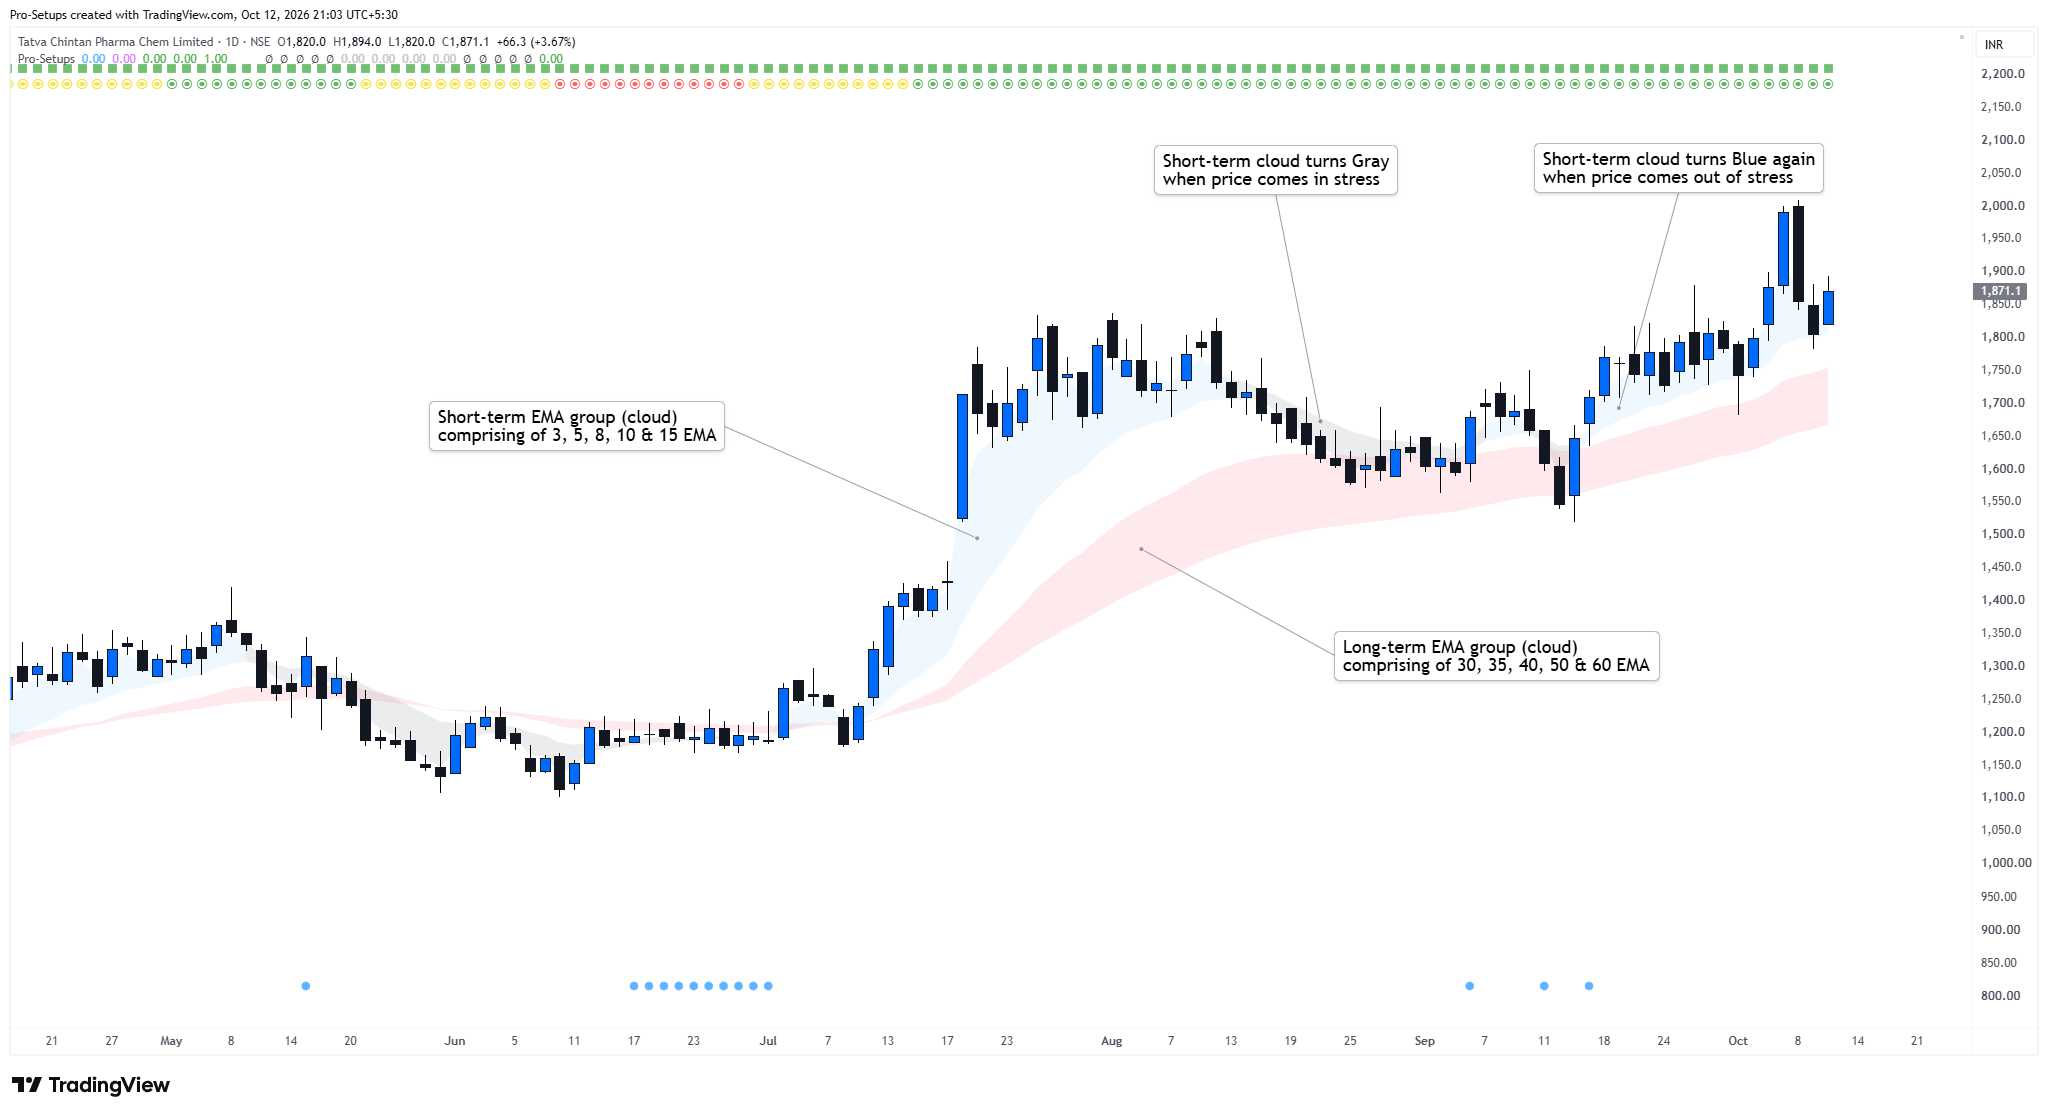
The EMA cloud concept is inspired by Daryl Guppy’s Guppy Multiple Moving Average (GMMA) framework, which uses groups of shorter and longer-duration EMAs to understand trend behaviour.
The indicator uses:
- Short-term EMA group: 3, 5, 8, 10 and 15 EMA
- Long-term EMA group: 30, 35, 40, 50 and 60 EMA
Instead of displaying all ten EMAs separately, the indicator converts each group into a cloud for easier visual interpretation. By default, the short-term cloud is Blue and the long-term cloud is Pink/Red.
The clouds help traders quickly observe expansion and contraction as the EMAs spread apart when trend strengthens or move closer together as price action becomes tighter.
When the short-term EMAs lose their constructive alignment - something that often happens when price comes under stress - the Blue cloud turns Gray. When the shorter EMAs regain their constructive alignment, it turns Blue again. This makes it easier for traders, especially newer traders, to see whether the trend is strengthening, weakening or tightening without having to interpret ten separate moving-average lines.
3. EMA Cloud Compression and Expansion
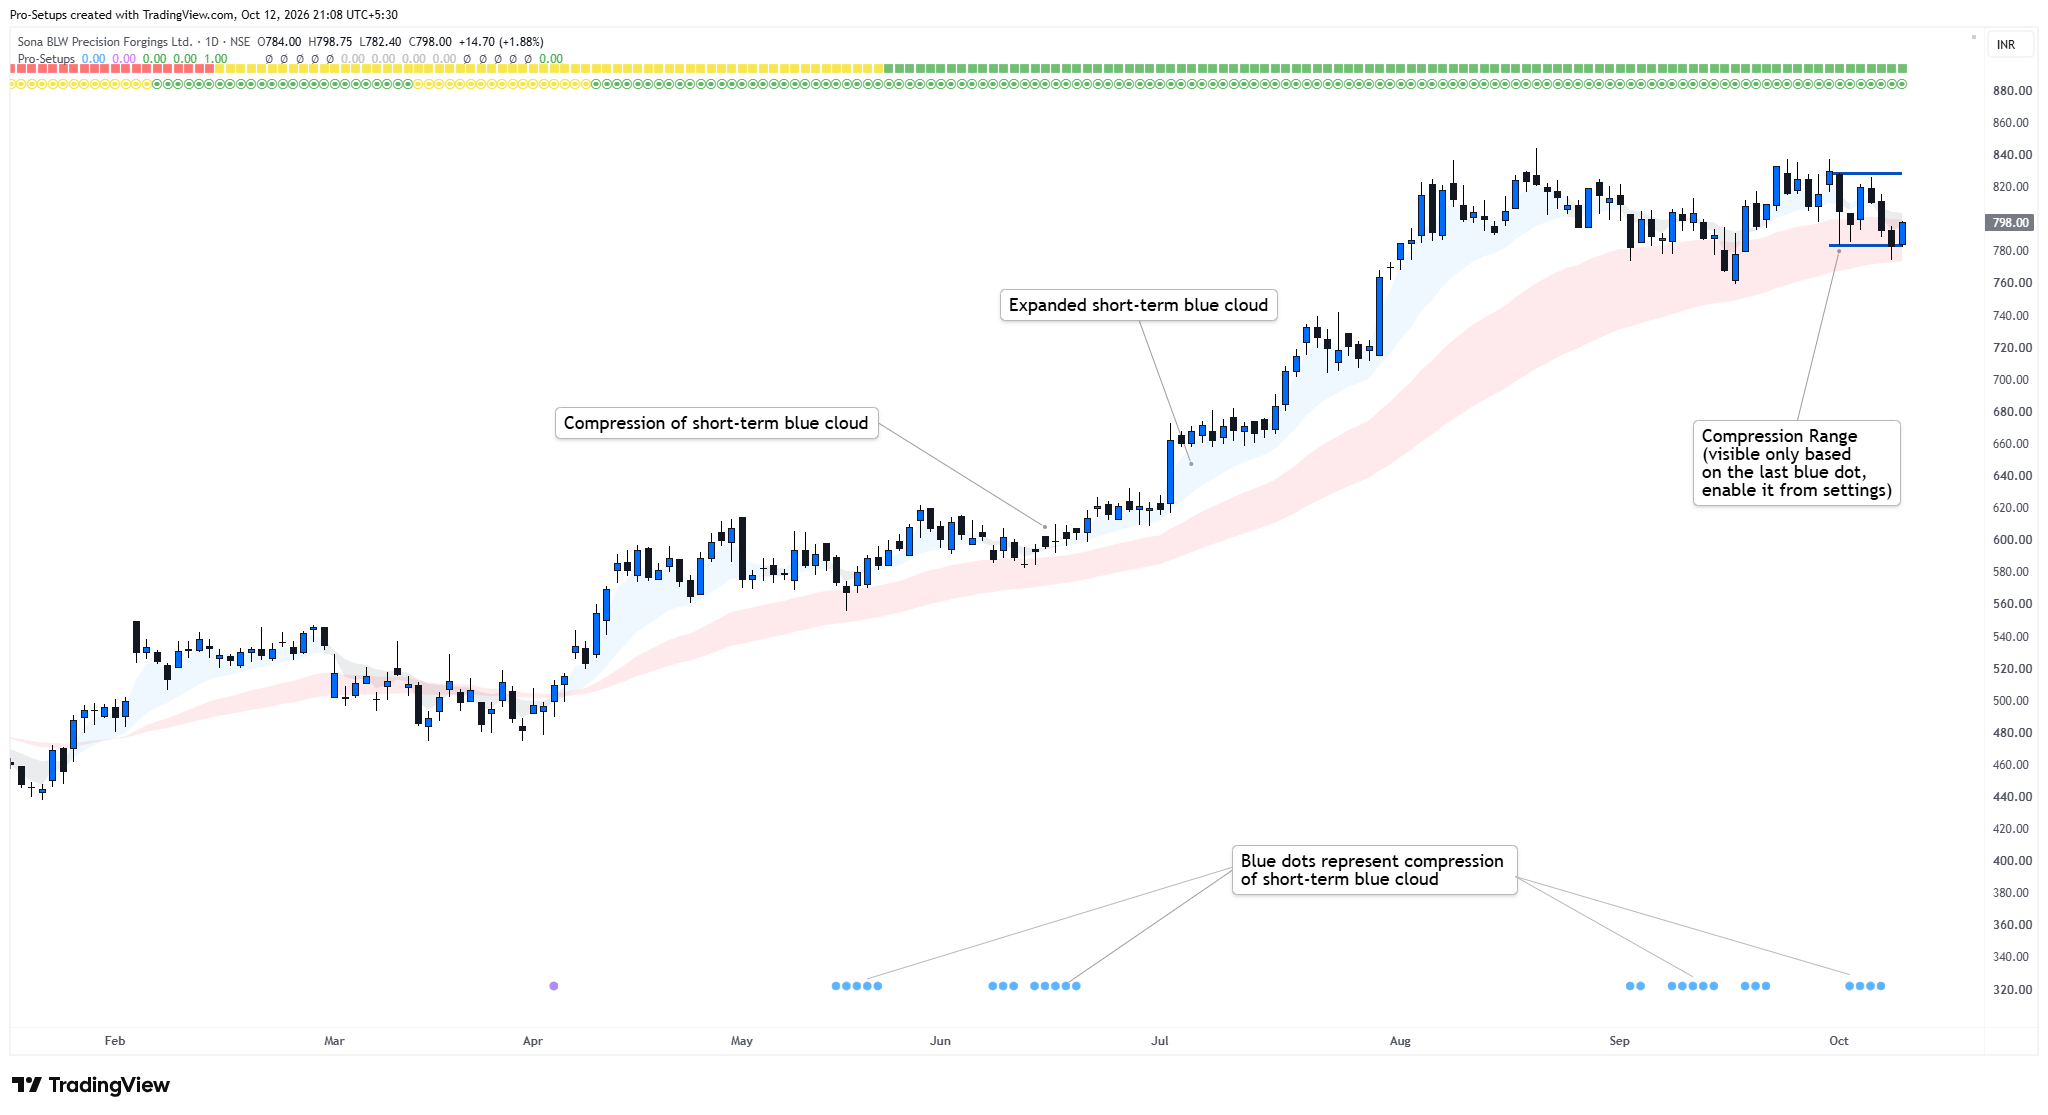
The short-term cloud is made from faster EMAs, so it compresses and expands more quickly and more often than the long-term cloud. When the short-term cloud compresses, it shows that the faster moving averages are coming closer together and price action is becoming tighter. This is often an area that swing traders may watch for a potential setup. When the cloud expands, the faster EMAs spread apart as price moves, which can help traders see that the move is progressing.
The indicator makes compression easy to see visually:
- A Blue dot appears at the bottom of the chart when the short-term cloud compresses.
- A Purple dot appears when both the short-term and long-term clouds compress at the same time.
Technically, compression is identified by measuring how closely the EMAs within each group are clustered together; the exact thresholds differ between Daily and Weekly charts.
Optional Compression Range
When EMA compression occurs and a Blue dot appears at the bottom of the chart, the user can choose to draw upper and lower reference lines around the recent price range.
The upper line is drawn at the highest high of the selected period, while the lower line is drawn at the lowest low. This helps the trader visually compare the EMA compression with the actual price range being formed.
The user can specify the number of candles to be used for this range from the indicator settings. Only the latest blue dot is considered for drawing of the compression range to keep the chart uncluttered. By default, this feature is disabled, but it can be enabled from the settings.
4. 50-Day / 10-Week Trend EMA and 200-Day / 40-Week EMA
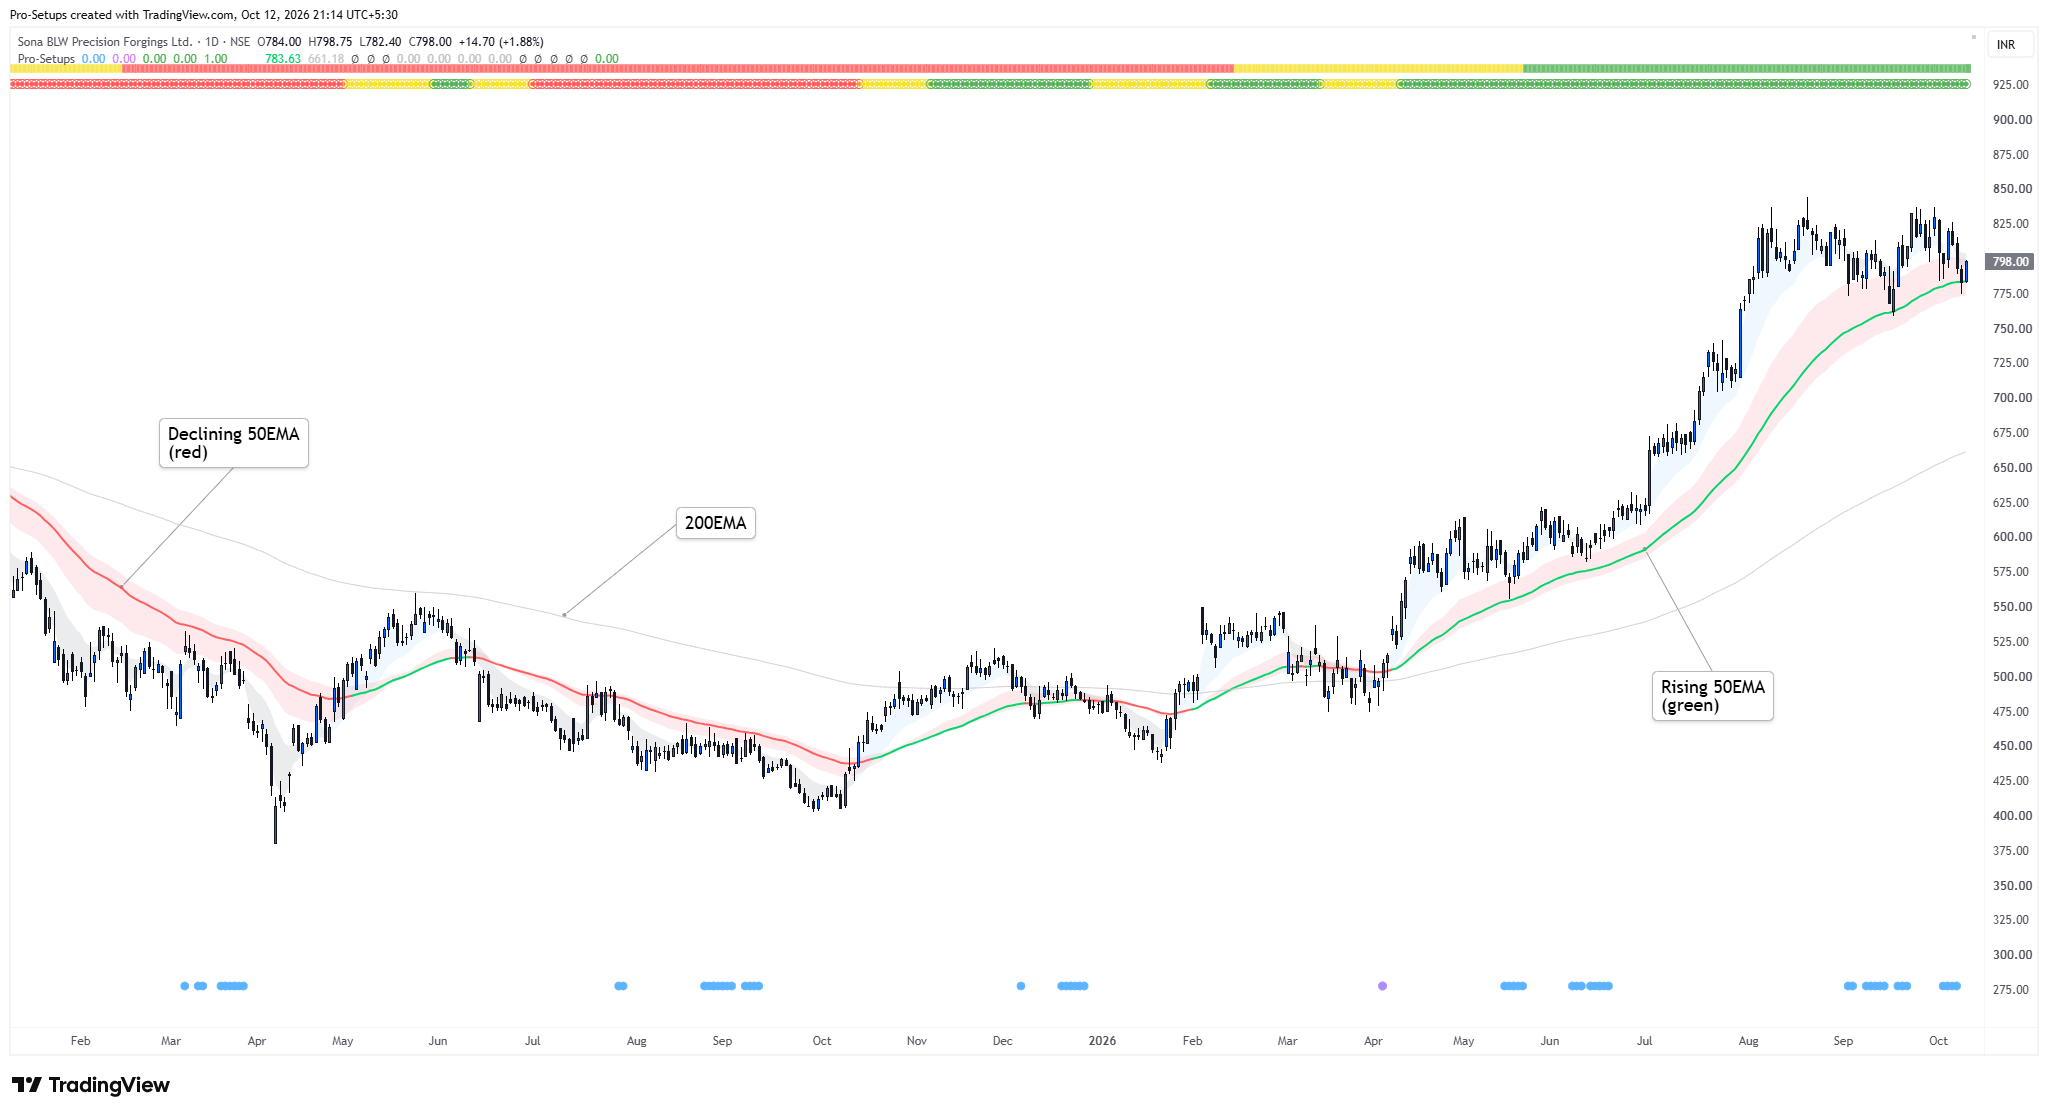
On Daily charts, the indicator displays the 50-day EMA, while on Weekly charts it displays the equivalent 10-week EMA.
The 50EMA on daily timeframe is classified as rising when the current EMA is more than previous bar’s EMA and its value ten bars earlier. Accordingly, the EMA is shown Green when rising and Red when declining. A simple rule that some swing traders may use for LONG setups is to focus only on stocks where the 50 EMA is rising and displayed in Green. This acts as a trend filter rather than a standalone Buy signal.
Similarly, the indicator plots 200-day EMA on daily timeframe, while on Weekly charts it displays the equivalent 40-week EMA.
Plotting of EMAs can be disabled from settings.
5. Custom Moving Averages
Three additional moving averages can be configured independently from the indicator’s settings. You can choose SMA, EMA or WMA, together with its own length and display color.
Their percentage distance from current price can also be displayed in the Commentary panel.
6. Fresh High Relative Volume (FHV)
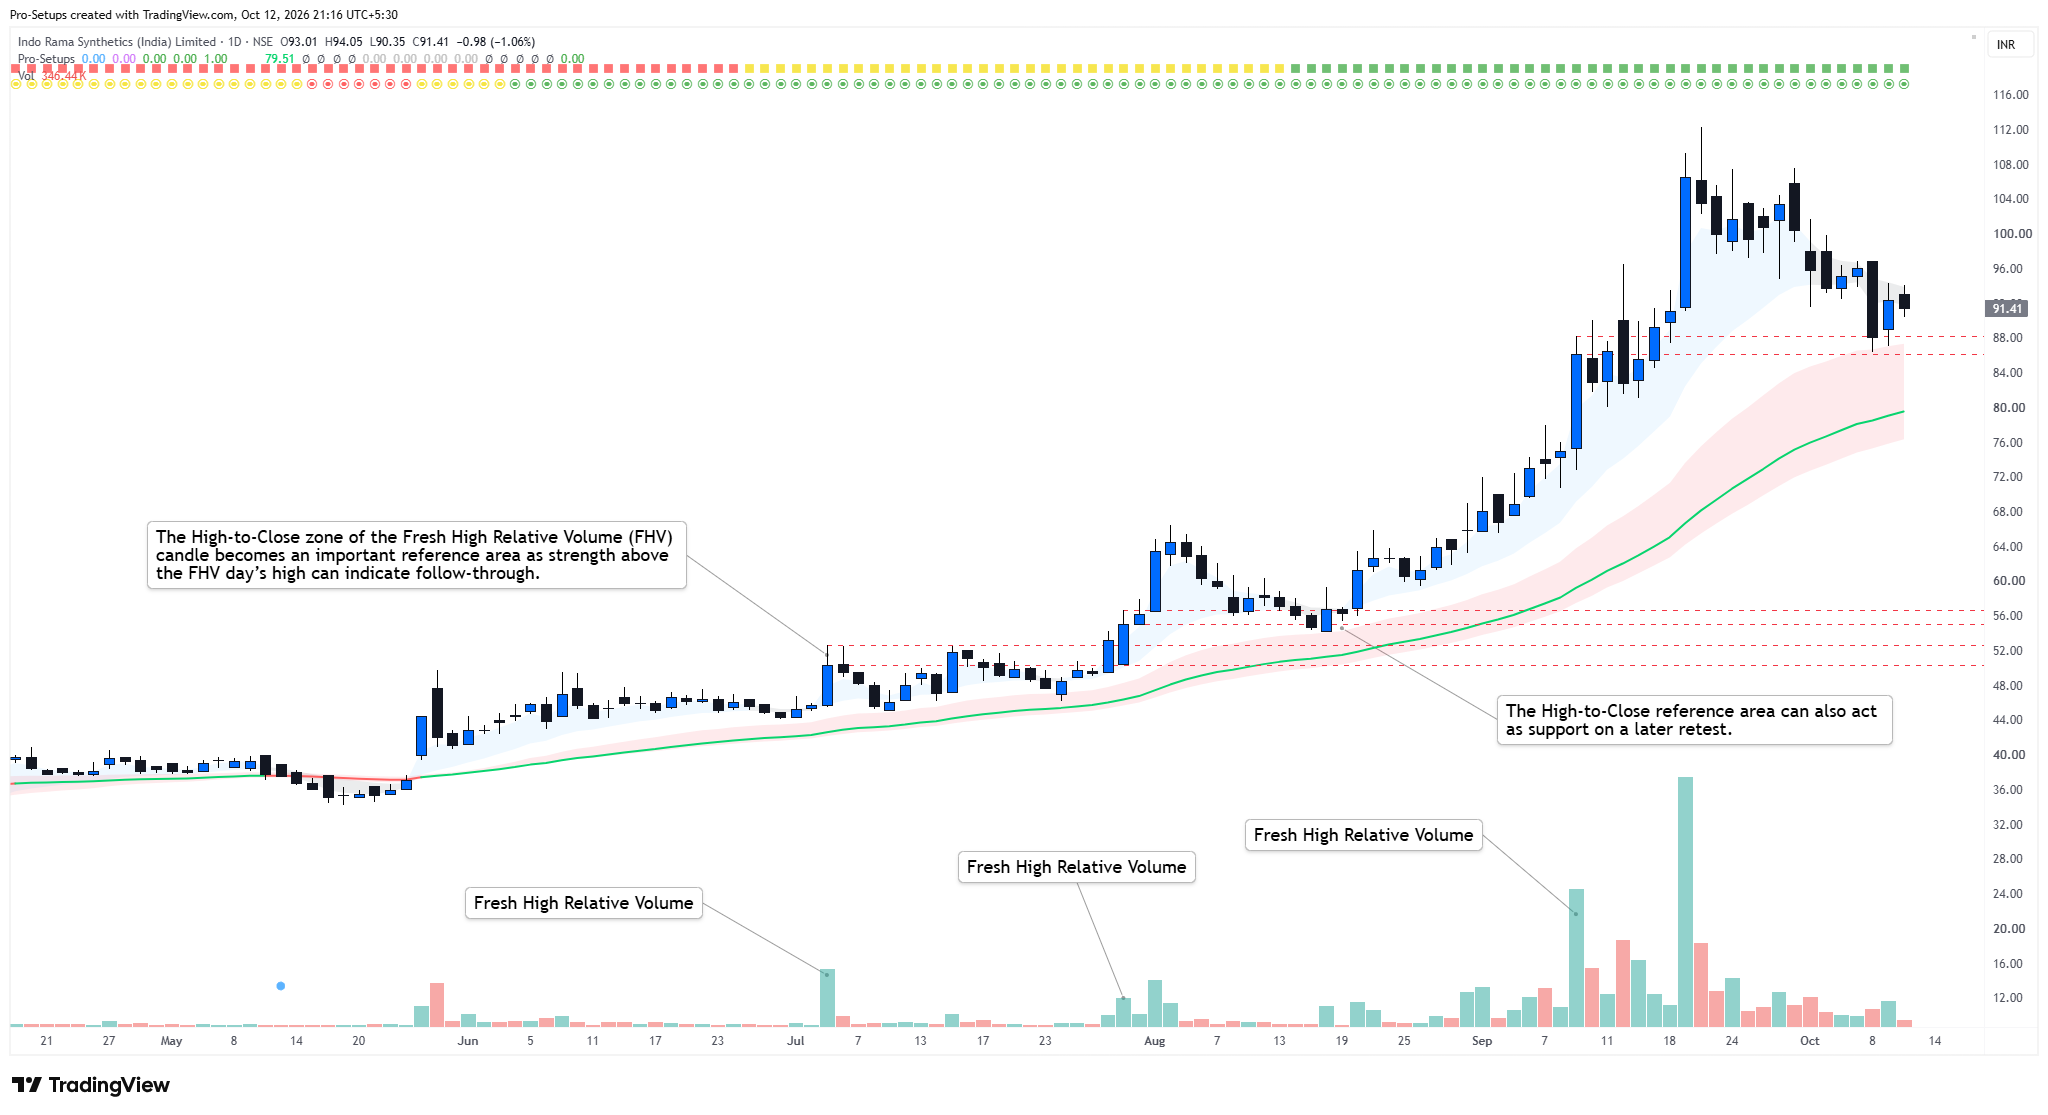
The indicator identifies Fresh High Relative Volume (FHV) events on Daily charts. These are fresh unusually high-volume up days that may indicate strong participation in the stock.
A Daily candle qualifies when:
- the candle closes above its opening price;
- its volume is at least 2 times the highest volume of the previous 10 trading days; and
- the candle closes in the upper half of its daily range.
When such a high-volume day occurs, the indicator draws reference lines at the high and closing price of that candle. This helps the trader easily track how price behaves after the event.
The number of previous FHV events displayed is controlled by the Lookback (bars) setting. This display setting does not change the 10-bar volume comparison used to identify an FHV candle.
The Commentary panel also shows:
- how many bars have passed since the latest High Relative Volume event; and
- how far the current price is from that event's high.
This feature highlights unusually strong relative volume only. It does not identify who was buying or selling and should not be treated as proof of institutional activity.
Why FHV is relevant: Fresh High Relative Volume (FHV) can help traders spot when a stock suddenly attracts much stronger participation than usual, especially after a quieter period. Such a day can put the stock on the watchlist for a possible developing setup. Traders can use the High-to-Close zone of the FHV candle as a reference area; strength above the FHV day’s high can indicate follow-through. Traders may monitor the same zone for support on a later retest. FHV is therefore best used as a context and confirmation tool, not as a standalone Buy signal.
7. Relative Strength Line
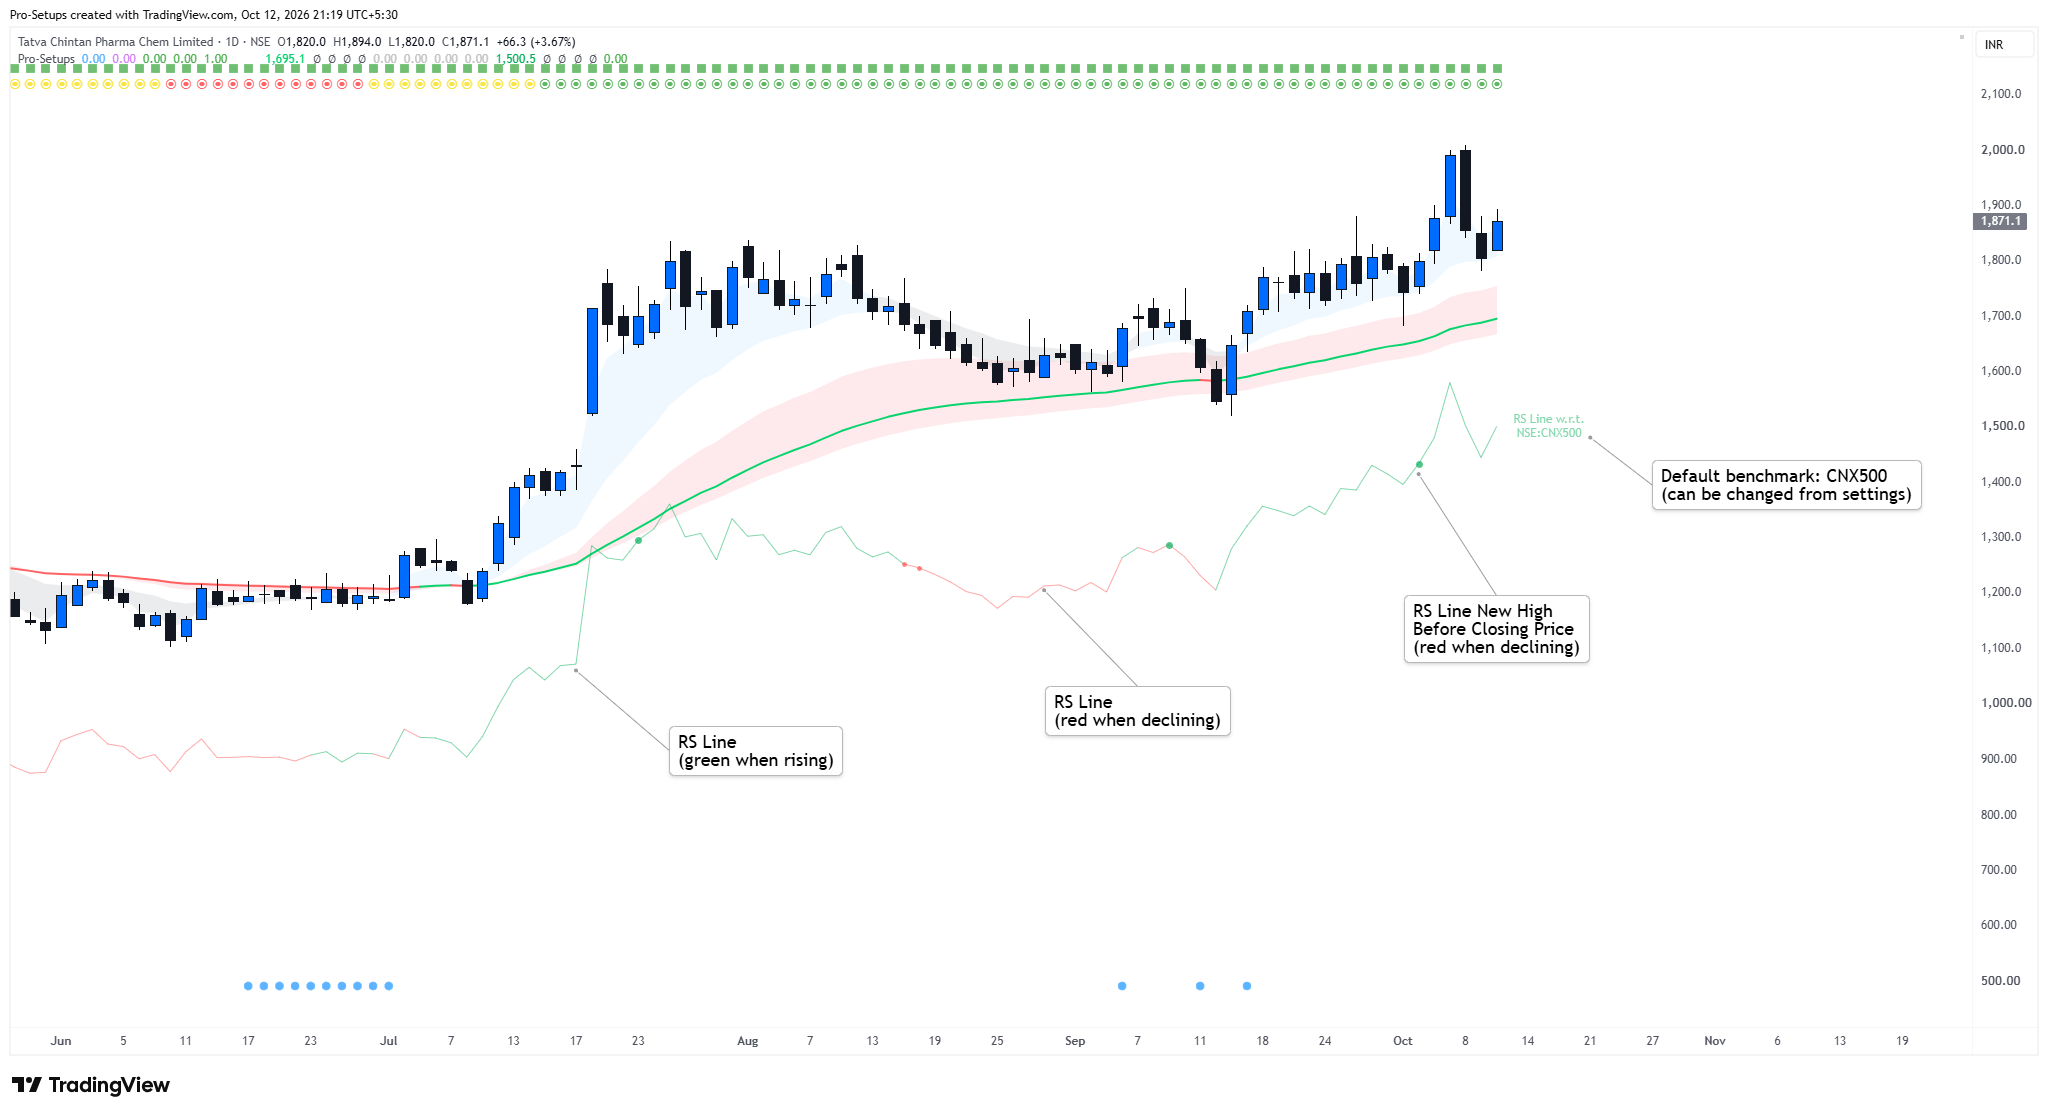
The Relative Strength (RS) Line shows how the stock is performing compared with a benchmark index selected by the user. By default, the indicator compares the stock with the CNX500 (Nifty500 index listed in India), but the benchmark can be changed from the settings.
In simple terms, the RS Line is calculated by dividing the closing price by the benchmark price. The scaling factor available in the settings only changes where the RS Line appears on the chart; it does not change the underlying Relative Strength calculation.
If the RS line is rising, the stock is outperforming the benchmark; if it is falling, the stock is underperforming. For swing traders, a rising RS Line is generally preferable, particularly when looking for LONG setups, because it shows that the stock is performing better than the broader market.
The indicator also highlights an important situation where the RS Line reaches a new high before the closing price itself reaches a new high. This can indicate that relative strength is improving even before price breaks out. Similarly, an RS new low before price makes a new lower close may indicate weakening relative performance. The lookback period for identifying these new highs and lows can be changed by the user.
8. Volatility Squeeze
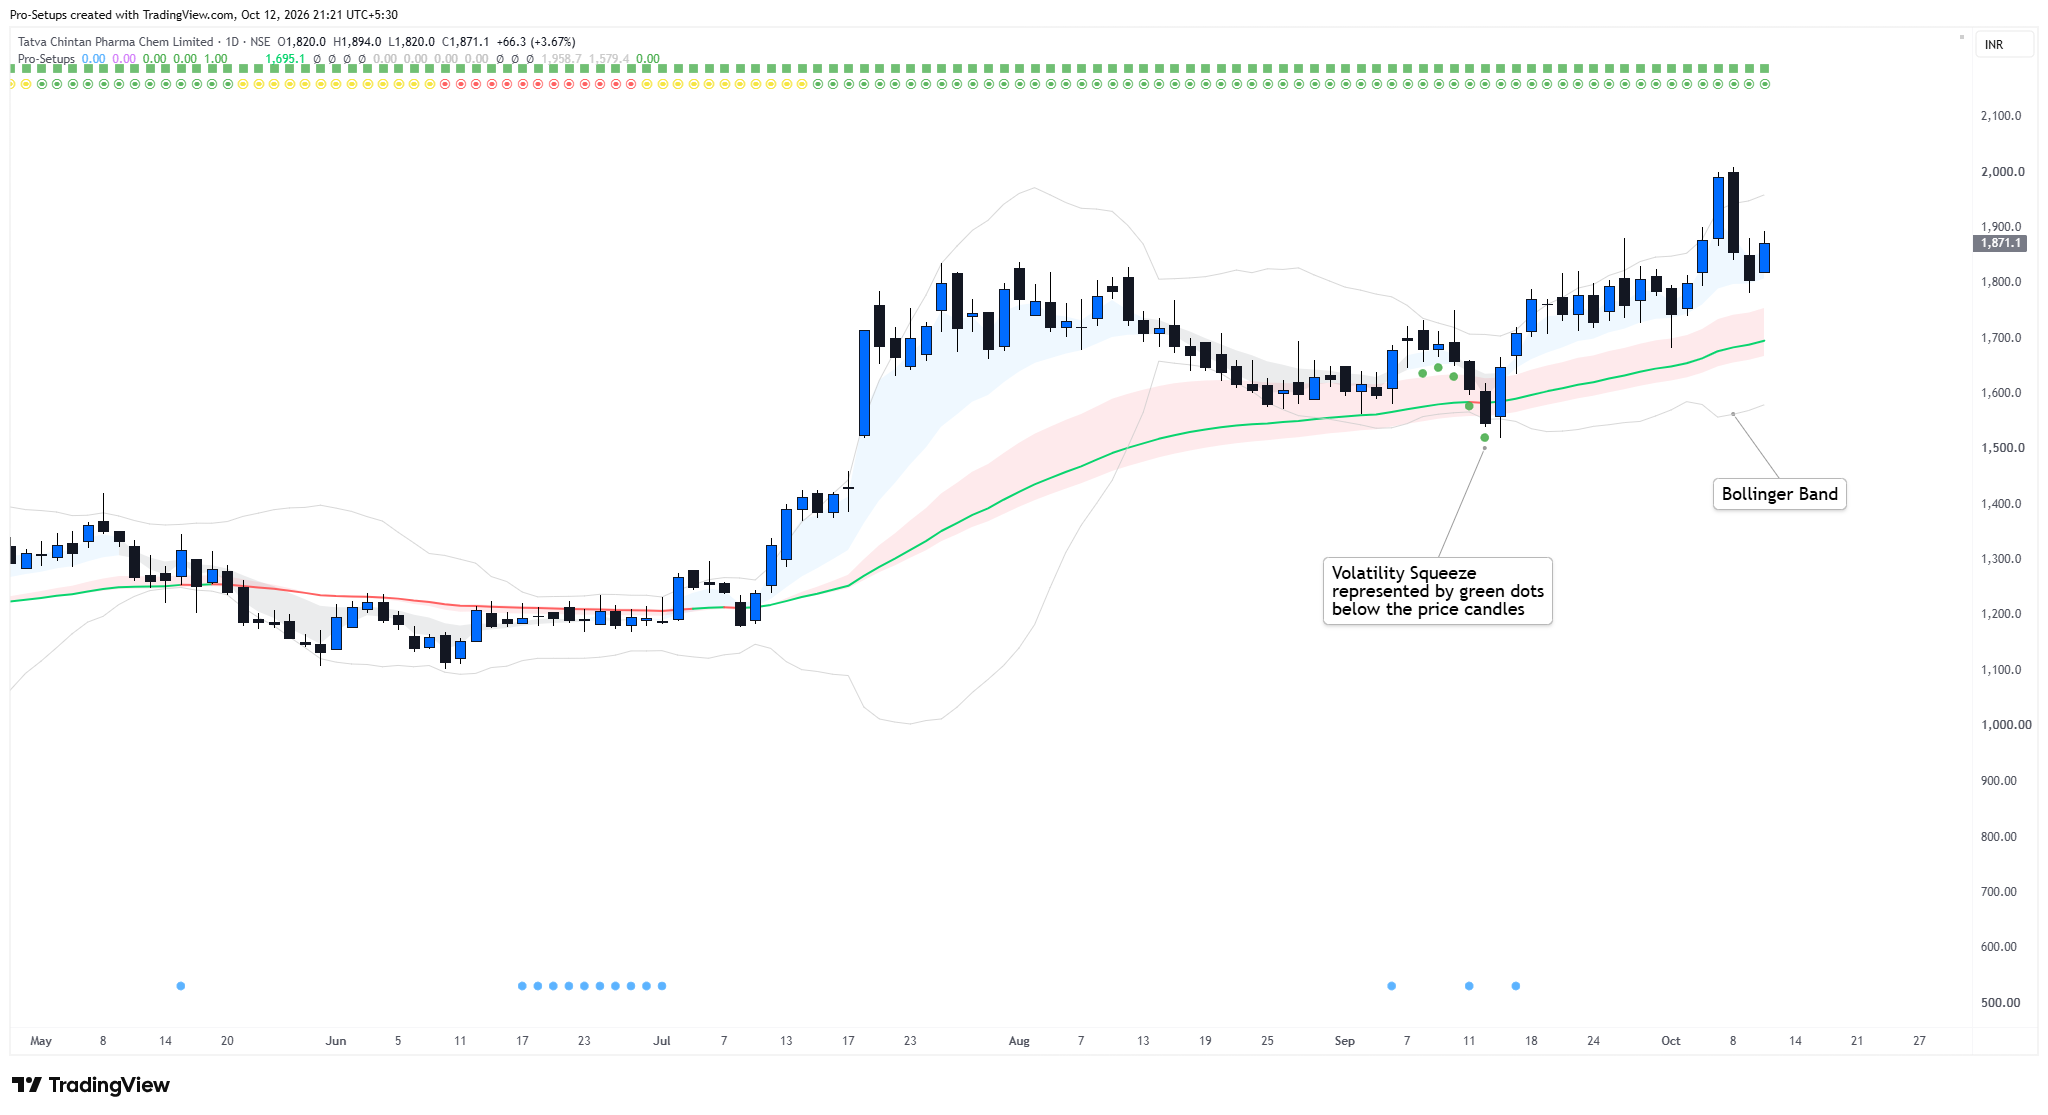
The indicator looks for periods when volatility becomes tight. It uses Bollinger Bands and a Keltner Channel. The Bollinger Bands are calculated using a 20-period moving average and two standard deviations. The Keltner Channel is built around the 20 EMA using ATR.
A squeeze is identified when the Bollinger Bands move inside the Keltner Channel and the Bollinger Bands are still contracting, i.e. the upper band is moving lower while the lower band is moving higher.
The Volatility Squeeze takes inspiration from the classic TTM Squeeze, but is slightly different from it. In the classic TTM Squeeze, the main squeeze condition is simply that the Bollinger Bands move inside the Keltner Channel; Pro-Setups adds the extra requirement that the Bollinger Bands themselves must be narrowing.
When the Pro-Setups squeeze condition is met, a Green dot appears below the candle. For swing traders, this helps highlight stocks where volatility is contracting and price may be building a tighter setup. The squeeze does not indicate the direction of the next move, so it is best used together with trend, volume and price structure.
You can enable or disable the visibility of Bollinger Band and Volatility Squeeze from the indicator’s settings.
9. Inside Bars, Mini Coil and Three Weeks Tight Closes (3WTC)
Inside Bars
The indicator can identify:
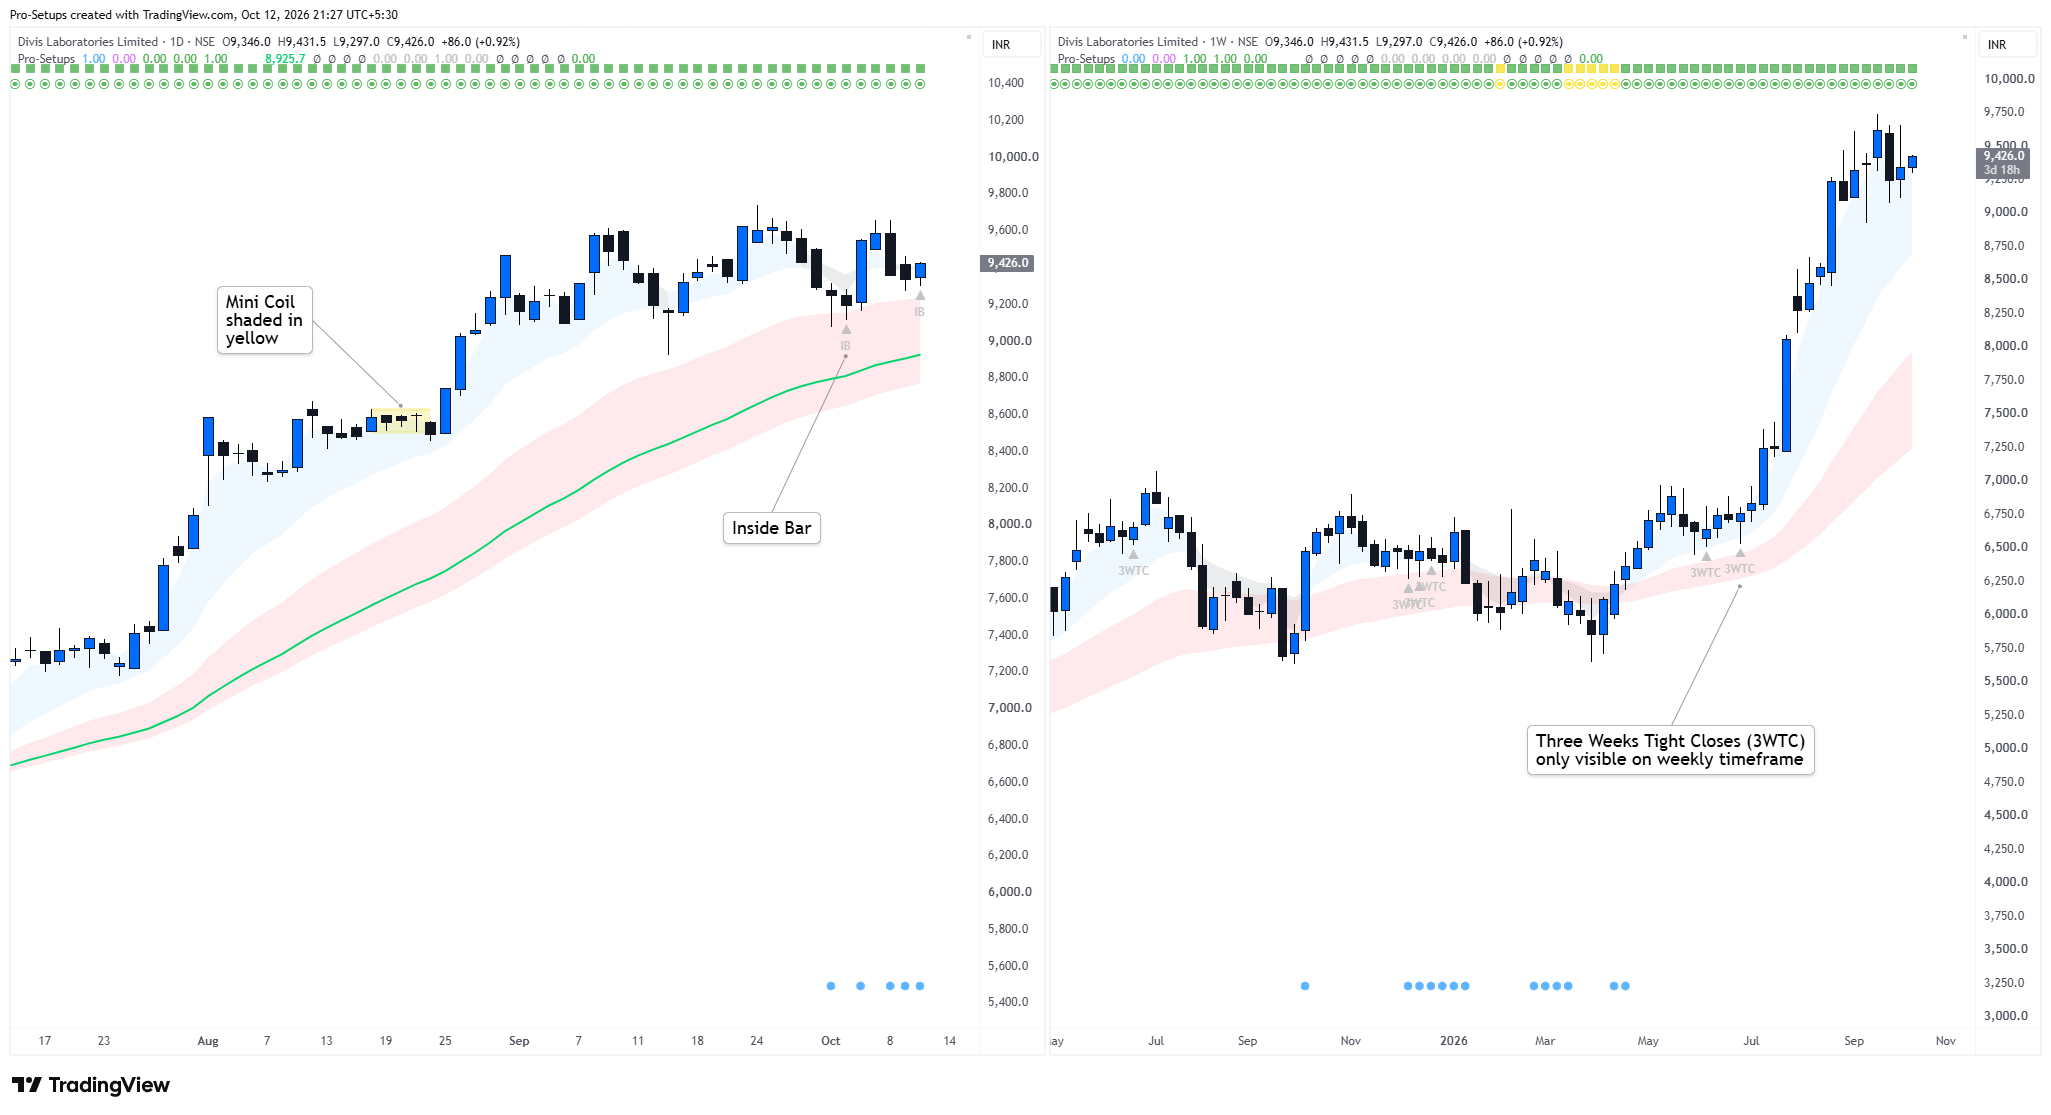
- Inside Bar: one candle is contained inside the high-low range of the preceding candle.
- Double Inside Bar: two consecutive candles remain progressively contained inside preceding ranges.
- Triple Inside Bar: three consecutive inside relationships occur.
Swing traders may use Inside Bars to identify stocks where price is becoming quiet after an earlier move. A breakout from the Inside Bar range can then be monitored, preferably in the direction of the broader trend.
The indicator shows these labels only on the last 10 candles so that the chart does not become overcrowded.
Mini Coil
A Mini Coil is another form of short-term price compression.
It looks for three recent candles that remain within the range of an earlier candle. When detected, the script highlights the upper and lower boundaries of the containing range.
This makes it easy to see a very tight area of consolidation. Swing traders may watch the upper and lower boundaries for a possible breakout from the coil.
The Mini Coil itself is not a Buy or Sell signal. The direction of the broader trend and the behaviour of price after leaving the range remain important.
Three Weeks Tight Close (3WTC)
The Three Weeks Tight (3WTC) feature is available on Weekly charts.
The basic idea is simple: the stock closes at very similar levels for three consecutive weeks. In Pro-Setups, the difference between the highest and lowest of those three weekly closes must be less than approximately 1.5%.
The indicator also applies additional filters so that the pattern occurs in a reasonably constructive structure. For example, the Weekly trend should not be Red, the 10-week EMA should be above the 40-week EMA, the three-week price range should remain controlled, and price should remain reasonably close to the 10-week EMA.
For swing traders, 3WTC can be useful because it shows that a stock is holding tightly instead of giving back much of its earlier move. Traders may then watch the high of the tight range for a possible breakout.
Again, 3WTC identifies tight price action; it does not guarantee that a breakout will occur.
10. Commentary Panel
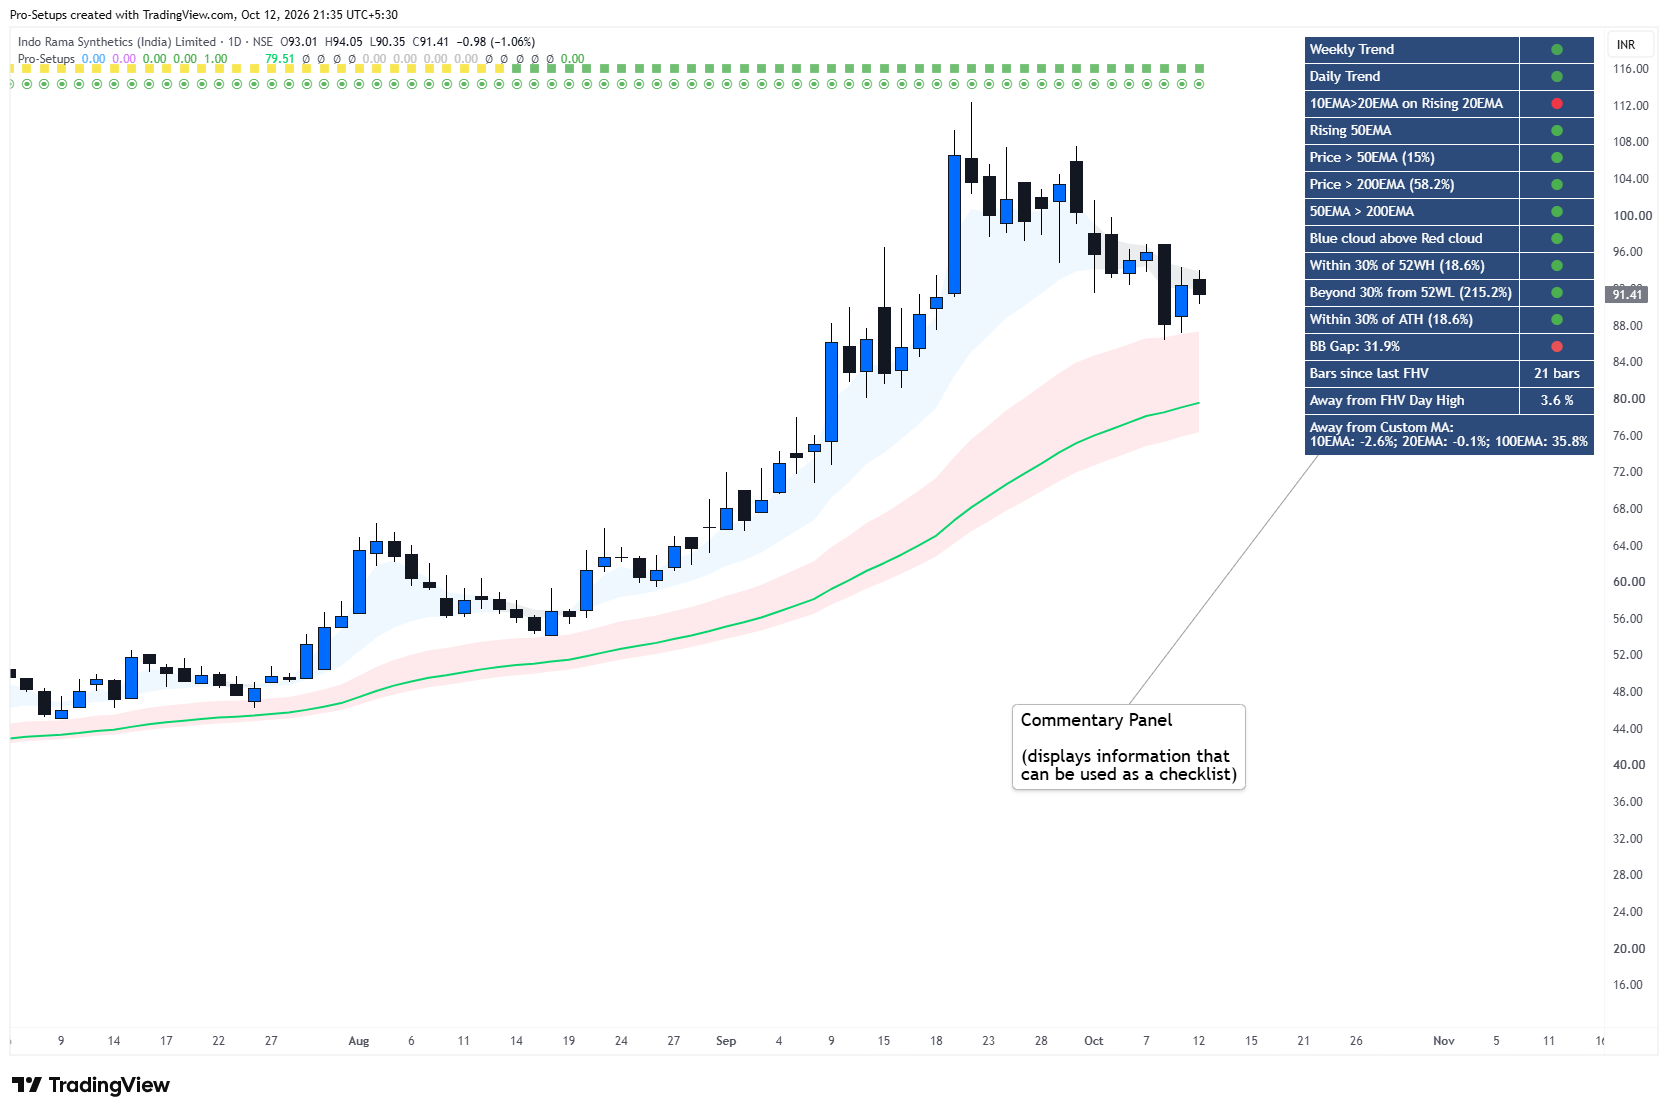
The Commentary panel is intended to function as a structured chart-reading checklist. Where appropriate, Green, Yellow and Red dots are used to make the information easier to read quickly.
On Daily charts, it shows:
- Weekly Trend – shows the broader higher-timeframe trend.
- Daily Trend – shows the current trend on the Daily chart.
- 10 EMA > 20 EMA on Rising 20 EMA – checks whether short-term momentum is positive and supported by a rising 20 EMA.
- Rising 50 EMA – indicates whether the intermediate-term trend is improving.
- Price vs 50 EMA – shows whether price is above or below the 50 EMA and the percentage distance from it.
- Price vs 200 EMA – shows whether price is above or below the 200 EMA and the percentage distance from it.
- 50 EMA > 200 EMA – gives a quick view of the broader moving-average structure.
- Short-term Cloud vs Long-term Cloud – shows whether the Blue short-term EMA cloud is above the Red/Pink long-term cloud.
- Distance from 52-Week High – shows how far the current price is from its 52-week high.
- Distance from 52-Week Low – shows how far the stock has moved away from its 52-week low.
- Distance from All-Time High – shows the distance from the All-Time High which is calculated using the historical data available to the script for that symbol.
- Bollinger Band Gap – measures how wide or tight the Bollinger Bands are and helps identify volatility contraction.
- Bars Since Last FHV – shows how many trading bars have passed since the latest Fresh High Relative Volume event.
- Distance from FHV Day High – shows how far the current price is from the high of the latest FHV candle.
- Distance from Custom Moving Averages – shows the percentage distance of price from the three user-selected moving averages.
The Commentary Panel is best considered as a checklist, not a scoring system. A trader can quickly review whether trend, price position, volatility and volume conditions are supportive before studying the chart in more detail.
How to Use Pro-Setups
A simple way to use the indicator is to analyse a chart in four steps:
1. Trend: Check the Weekly and Daily Trend Bars, EMA clouds and 50/200 EMA structure.
2. Compression: Look for EMA-cloud compression, Volatility Squeeze, Inside Bars, Mini Coils or 3WTC.
3. Participation: Check whether Fresh High Relative Volume has appeared and how price is behaving around the FHV candle.
4. Relative Strength: Check whether the stock is outperforming or underperforming the selected benchmark.
These conditions are intended to be read together as chart context rather than as mechanical Buy or Sell signals.
This sequence is the principal reason the individual features are part of the same indicator.
Traders can switch individual features on or off depending on their own trading process.
Timeframe behaviour
The indicator is primarily designed for Daily and Weekly charts.
Some components can display on intraday charts of one hour or higher, but several modules deliberately rely on Daily or Weekly information.
The high-relative-volume condition is a Daily condition.
Three Weeks Tight is a Weekly condition.
The complete Commentary panel is intended for Daily analysis.
On Daily charts the Weekly Trend is calculated from Weekly timeframe data. On a Weekly chart, both trend bars represent the Weekly Trend. No trend bars are displayed on timeframes lower than the Daily chart.
Users should therefore expect the most complete behaviour on Daily and Weekly charts.
Repainting and developing bars
The indicator uses information available up to the current candle. Therefore, conditions calculated using an open candle may change until that candle closes.
For example, an Inside Bar, compression condition or volume condition visible during the trading session may disappear if price changes before the Daily candle closes.
Similarly, the Weekly Trend shown on a Daily chart uses the current Weekly candle. Since that Weekly candle continues to develop during the week, its trend classification can change until the week closes.
Traders who want confirmed conditions should therefore wait for the relevant Daily or Weekly candle to close.
Important limitations
Pro-Setups is intended to help traders read the chart more easily. It is an analytical tool rather than a trading system.
It does not forecast future price.
A volatility or EMA contraction does not guarantee that price will subsequently break out.
A high-volume event does not establish who bought or sold the security.
A strong Relative Strength Line does not guarantee continued outperformance.
Trend classifications can change as market conditions change.
The usefulness of Relative Strength depends on the benchmark selected.
The indicator should therefore be used together with the trader's own analysis, entry rules, stop-loss discipline and risk management.
Intended use
Pro-Setups is primarily designed as a visual swing & positional trading toolkit. It is intended to help discretionary traders organize technical information that would otherwise require repeated inspection of several separate chart elements.
It helps traders quickly see whether a stock is trending well, becoming tight, showing unusually strong volume, and outperforming the broader market. These conditions can help a trader build a watchlist and identify charts that may deserve closer attention.
The indicator is an analysis tool and does not constitute investment advice or a recommendation to buy or sell any security.
Protected Source Code
Pro-Setups is published as a Protected TradingView script. Its Pine Script source code is visible only to the author, while any TradingView user can add the indicator to their chart and Favorites and use it for free without requiring permission.
The source is protected because the script contains custom calculations, thresholds and interaction between its trend, EMA-compression, relative-volume, Relative Strength and chart-analysis modules. The description above explains how those features work and how they are intended to be used, while the underlying implementation remains protected.