

Pro-Setups: Financials
Purpose of the Indicator
Pro-Setups: Financials indicator brings together important financial and valuation summary directly on TradingView charts, giving traders and investors a quick overview of a company’s performance and valuation. The indicator presents current and historical valuations, annual and quarterly financial results, profitability ratios in a compact format. It also highlights certain financial conditions that may deserve closer attention, such as accelerating sales and earnings, favourable earnings comparisons, and improving incremental returns on capital.
The indicator is designed to provide a quick fundamental snapshot alongside price charts, complementing technical analysis. It does not generate mechanical Buy or Sell recommendations.
What Makes This Indicator Different
The key feature of Pro-Setups: Financials is its Key Notes, which automatically analyse financial data to highlight important developments in a company’s growth, profitability, and capital efficiency. Rather than simply displaying financial figures, the indicator identifies certain conditions that may deserve closer attention, such as Sales Acceleration, Earnings Acceleration, Code 33, Easy Earnings Comparison (EEC) and Incremental & and ROCE.
Alongside Key Notes, the indicator provides annual and quarterly financial results and compares current valuation multiples with their historical three-year ranges, bringing important fundamental information together in one compact display.
Users can choose between Financials Summary, which displays the summary financial and valuation information in a tabular format, and Key Notes, which displays only the identified financial observations for a cleaner chart.
The following sections explain what each feature measures, how it is calculated, and why it may be useful.
1. Valuation Summary
The Valuation Summary displays the company’s Market Capitalisation, Free Float percentage, and commonly used valuation multiples.
Market Capitalisation and Free Float
- Market Capitalisation: The approximate market value of the company’s outstanding equity shares.
- Free Float: The percentage of outstanding equity shares classified as freely tradable.
Valuation Multiples
The indicator displays four valuation ratios:
- P/Sales (Price to Sales)
- P/BV (Price to Book Value)
- EV/EBITDA
- P/E (Price to Earnings)
Current Valuation vs. 3-Year Range
The comparison helps investors assess whether a stock is trading closer to its historical valuation highs or lows. For companies with shorter trading histories, the displayed range may be based on a shorter available period. For each valuation multiple, the indicator displays:
- Current: The valuation multiple based on the latest available financial data and market price.
- 3-Yr. Range: The lowest and highest observed valuation multiples over approximately the last three years.
2. Annual Financials
The Annual Financials section presents up to five financial years of historical results, allowing users to evaluate the company’s longer-term growth and profitability. The indicator also displays the year-on-year percentage change in Revenue and PAT (Profit After Tax), making it easier to identify periods of stronger or weaker business growth.
ROE (Return on Equity) and ROCE (Return on Capital Employed)
The indicator retrieves annual ROE figures directly from TradingView’s financial data.
ROCE is calculated using the following formula: ROCE = EBIT / Average Capital Employed × 100
Where:
- EBIT = EBITDA − Depreciation & Amortisation
- Capital Employed = Shareholders’ Equity + Total Debt
- Average Capital Employed = (Current Year's Capital Employed + Previous Year’s Capital Employed) / 2
3. Quarterly Financials
The Quarterly Financials section presents the latest five reported quarters, focusing on changes in business performance over shorter periods. It displays three financial metrics: Revenue, PAT (Profit After Tax), OPM% (Operating Profit Margin). The indicator uses EBITDA Margin as its measure of Operating Profit Margin.
The accompanying change shows year-on-year difference. Green ▲ indicates positive growth or improvement, while Red ▼ indicates negative growth or deterioration. The indicator also highlights transitions from Loss to Profit or Profit to Loss, wherever applicable. These colours help users identify changes quickly but should not be interpreted as investment recommendations.
4. Key Notes
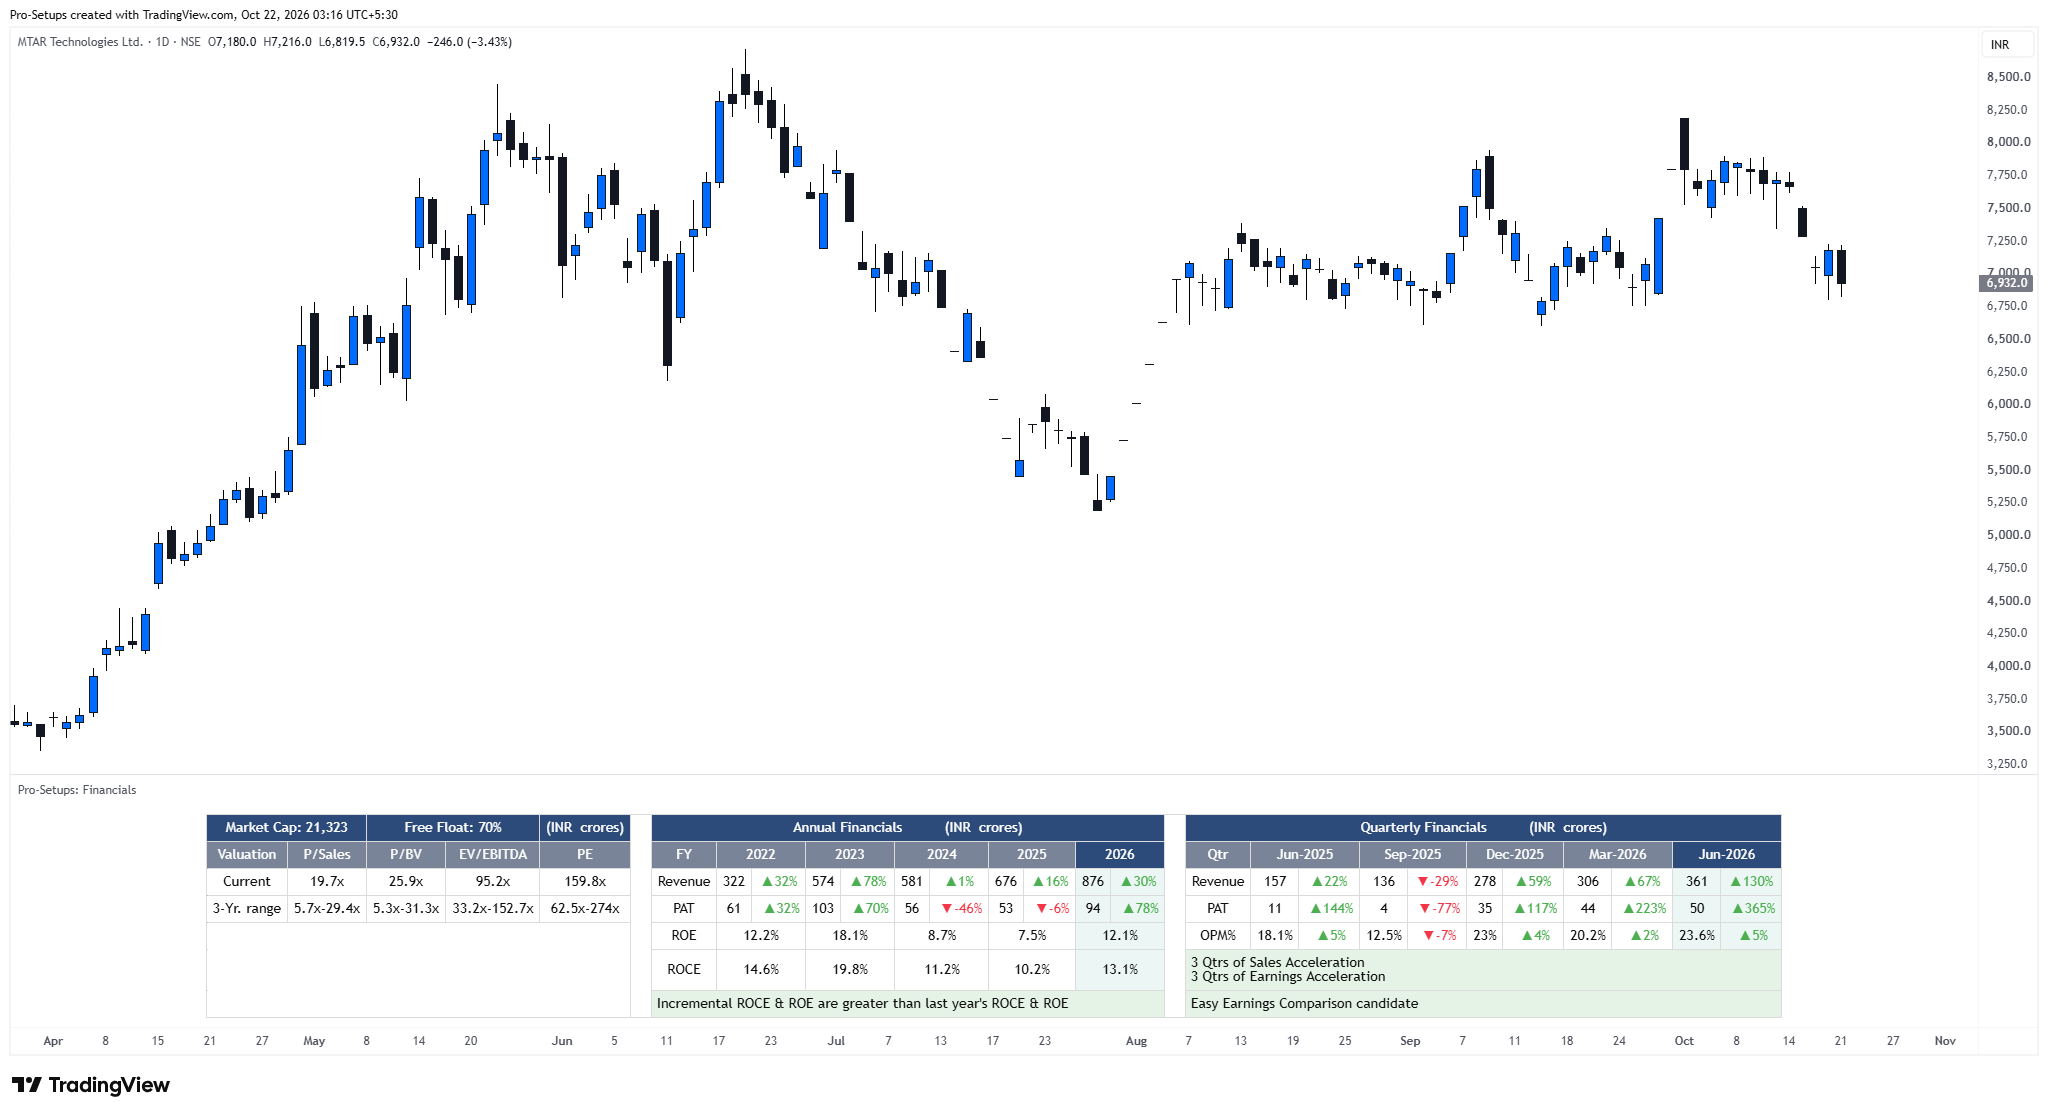
The Key Notes section is an important feature of the Pro-Setups: Financials indicator. It focuses on three areas:
- Sales and Earnings Acceleration
- Easy Earnings Comparison (EEC)
- Incremental ROE and ROCE
A. Sales and Earnings Acceleration
The concept of Earnings Acceleration is inspired by Mark Minervini’s book Trade Like a Stock Market Wizard, where he discusses the importance of three consecutive quarters of improving year-on-year earnings growth rates.
We have extended this concept to Sales Acceleration, applying the same principle to revenue growth. Additionally, we have introduced two-quarter acceleration for both Sales and Earnings to help identify improving business momentum at an earlier stage.
For example, if a company’s year-on-year quarterly earnings growth increases from 5% in Q1 to 10% in Q2 and 20% in Q3, it indicates 2 quarters of Earnings Acceleration. If the growth rate further increases to 30% in Q4, it indicates 3 quarters of Earnings Acceleration.
The indicator identifies the following conditions:
Sales Acceleration
- 2 Quarters: Year-on-year revenue growth rates have improved for two consecutive quarters.
- 3 Quarters: Year-on-year revenue growth rates have improved for three consecutive quarters.
Earnings Acceleration
- 2 Quarters: Year-on-year PAT growth rates have improved for two consecutive quarters.
- 3 Quarters: Year-on-year PAT growth rates have improved for three consecutive quarters.
The indicator requires the relevant growth rates to be positive.
Why Acceleration Matters
Growth is important, but the direction of growth is equally relevant. A company growing its revenue at 20% may be experiencing improving momentum if its earlier growth rates were 5% and 10%. Conversely, the same 20% growth may represent deceleration if earlier growth rates were 40% and 30%. Accelerating Sales and Earnings growth may indicate strengthening business performance, improving profitability, or increasing operating leverage. Identifying such acceleration early can help investors recognise companies with improving financial momentum.
Code 33 - Three Quarters of Acceleration
Code 33 is also inspired from the same book by Mark Minervini. It identifies companies where:
- Revenue and PAT shows 3 successive quarters of acceleration.
- Either Operating Profit Margin (OPM) or Net Profit Margin (NPM) improves sequentially across the latest four reported quarters. So, if the OPM improves from 12% in Q1 to 14% in Q2, 16% in Q3 and 18% in Q4, it indicates 3 quarters of consecutive margin improvement. The same condition can also be satisfied through improving NPM; both margins need not improve simultaneously.
Simultaneous acceleration in revenue, earnings, and profit margins can indicate improving business momentum. Code 33 is an observation based on reported financial data, not a prediction that growth will continue.
B. Easy Earnings Comparison (EEC)
The concept of Easy Earnings Comparison (EEC) was explained in the book ‘Insider Buy Superstocks’ by Jesse Stine. EEC identifies companies where the upcoming quarter may benefit from comparison against a relatively weak historical quarter.
The indicator analyses historical revenue and earnings patterns to identify companies that may be positioned to report stronger year-on-year earnings growth due to a favourable comparison base. When the required conditions are satisfied, the indicator displays Easy Earnings Comparison Candidate in the Key Notes.
Why EEC Matters
A company may find it easier to report a strong year-on-year earnings growth percentage when the corresponding quarter of the previous year had unusually weak profits. For example, if a company earned only $10 million in the comparison quarter, reporting $30 million in the upcoming quarter would translate into 200% year-on-year profit growth. EEC attempts to identify situations where such a favourable comparison may be developing.
However, an easy comparison base does not guarantee strong upcoming results. Actual earnings will depend on the company's business performance during the new quarter.
C. Incremental ROE and ROCE
Traditional ROE and ROCE measure the returns generated on a company's overall capital base. Incremental ROE and ROCE examine how changes in profitability compare with changes in the capital employed.
Incremental ROE
Incremental ROE compares the change in annual PAT with the change in average shareholders’ equity. It helps assess the profitability associated with changes in the company’s equity capital.
Incremental ROCE
Incremental ROCE compares the change in annual EBIT with the change in average capital employed. It helps assess how efficiently changes in the company’s capital base are translating into additional operating profit.
The indicator highlights situations where incremental ROE or incremental ROCE exceeds the corresponding latest annual ROE or ROCE.
Why Incremental Returns Matter
A company may report a healthy historical ROE or ROCE, but its incremental returns can provide additional insight into how efficiently capital is being deployed. For investors, tracking incremental ROCE and ROE offers an edge in identifying early signs of operational improvement and future wealth creation. Companies that can sustain high incremental returns are often the ones that can deliver the best long-term shareholder value.
These calculations should be interpreted alongside the company’s financial statements and other fundamental factors.
5. Display Options and Customisation
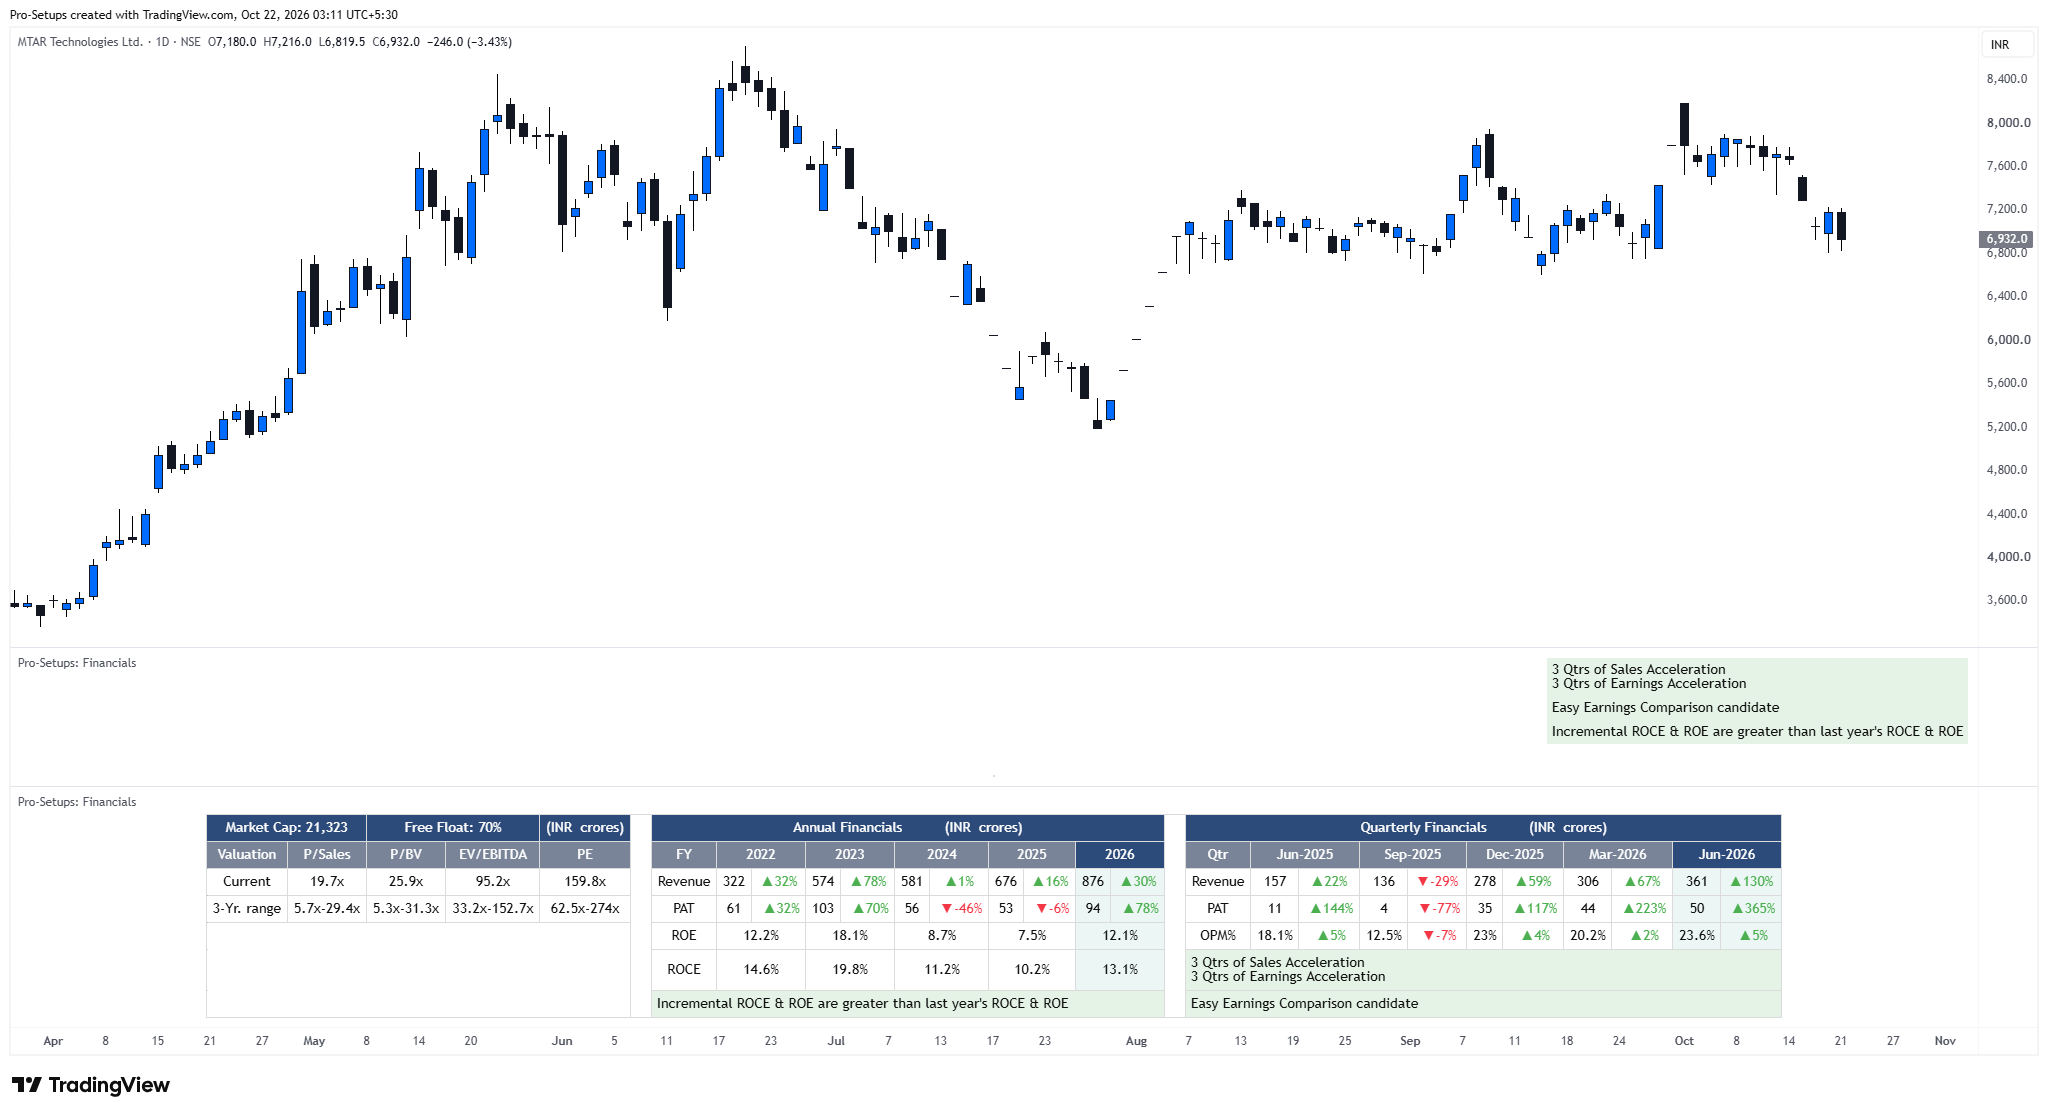
Users can choose between:
- Financials Summary: Displays the complete Valuation, Annual Financials, Quarterly Financials, and Key Notes sections.
- Key Notes: Displays only the identified financial observations, allowing users to maintain a cleaner chart layout.
Automatic Financial Scale
The indicator automatically adjusts the scale of monetary values.
- INR-denominated securities are displayed in Crores by default.
- Other securities are displayed in Millions or Billions, depending on the size of their annual revenue.
Users can also manually select Billion, Million, Crores, Lakhs, or None.
Table Appearance
- Users can adjust table size, choose the position of Key Notes, and customise table colours.
- Additional explanations of selected financial conditions are available through cell tooltips.
Timeframe Behaviour and Financial Data
- The indicator is most useful on Daily and Weekly charts for reviewing financial performance alongside price behaviour and hence not displayed on timeframe less than Daily charts.
- The indicator retrieves available annual and quarterly financial information through TradingView's financial data functions. Where the required information is unavailable, the corresponding table cells may remain blank.
- Financial statements are reported periodically rather than on every trading day. Consequently, financial figures generally remain unchanged between reporting updates, while price-dependent valuation measures can change as the stock price moves.
Important Limitations
Pro-Setups: Financials is an analytical tool, not a trading system or investment recommendation.
- Financial information depends on data available through TradingView and may differ from other financial databases.
- Strong historical growth and profitability do not guarantee future performance or a profitable trade or investment.
- Sales & Earnings acceleration or Code 33 do not guarantee continued earnings growth or positive stock-price performance.
- An EEC candidate does not guarantee strong results in the upcoming quarter.
- High incremental ROE or ROCE does not automatically indicate superior capital allocation.
- Historical valuation ranges do not establish whether a stock is fundamentally undervalued or overvalued.
- Financial ratios may require different interpretations across industries and businesses with specialised accounting structures.
Users should independently review company financial statements, accounting policies, exceptional items, debt, cash flows, and other relevant information before making investment decisions.
Intended Use
Pro-Setups: Financials indicator is designed to help traders and investors provide a snapshot about a company’s financial history, identify changes in business momentum, assess capital efficiency, and place current valuations in historical context. The indicator is best used as a supporting analytical tool to initiate broader fundamental research. No single financial metric or Key Note should be treated as a standalone reason to buy or sell a security.
Protected Source Code
Pro-Setups: Financials indicator is published as a Protected TradingView script. Its Pine Script source code is visible only to the author, while any TradingView user can add the indicator to their chart and Favorites and use it for free without requiring permission.
The source is protected because the script contains custom calculations and logic for identifying Sales and Earnings Acceleration, Code 33, Easy Earnings Comparison (EEC), Incremental ROE and ROCE, and historical valuation ranges. The description above explains how these features work and how they are intended to be used, while the underlying implementation remains protected.