

Purpose of the indicator
The indicator brings together several important volume concepts and correlates volume to price-action to draw observations to help traders better understand the participation behind a stock's price movements.
The indicator highlights Pocket Pivot volume candles, significant historical volume highs, Fresh High Relative Volume (FHV), and periods when trading activity becomes unusually quiet. These features help traders recognize changes in trading participation, identify volume contraction during consolidations, and spot volume expansion during potential breakouts. These features are intended to work together rather than as unrelated volume indicators.
The indicator does not generate mechanical Buy or Sell recommendations.
The sections below explain how the main features are calculated, what they represent, and how traders may use them in practice.
It is important to understand how the indicator defines Up Bars and Down Bars, as these terms are used in several calculations throughout the indicator.
- Up Bar: When current bar’s close is greater than previous bar’s close.
- Down Bar: When current bar’s close is lower than previous bar’s close.
- It is assumed that if the stock has an Up Bar, the volume was due to the buying pressure and if the stock has a Down Bar, the volume was due to the selling pressure.
1. Volume Bars and Colour Classification
The indicator uses different colours to help traders quickly recognize important volume activity.
- Dark Grey – Up Volume: Volume on an Up Bar.
- Light Grey – Down Volume: Volume on a Down Bar.
- Blue – Pocket Pivot Up Volume: When volume on an Up Bar is greater than the highest volume on a Down Bar, subject to additional price and closing-range conditions explained below in the Pocket Pivot section.
- Red – Pocket Pivot Down Volume: When volume on a Down Bar is greater than the highest volume on an Up Bar, subject to additional price and closing-range conditions.
2. Pocket Pivot Volume
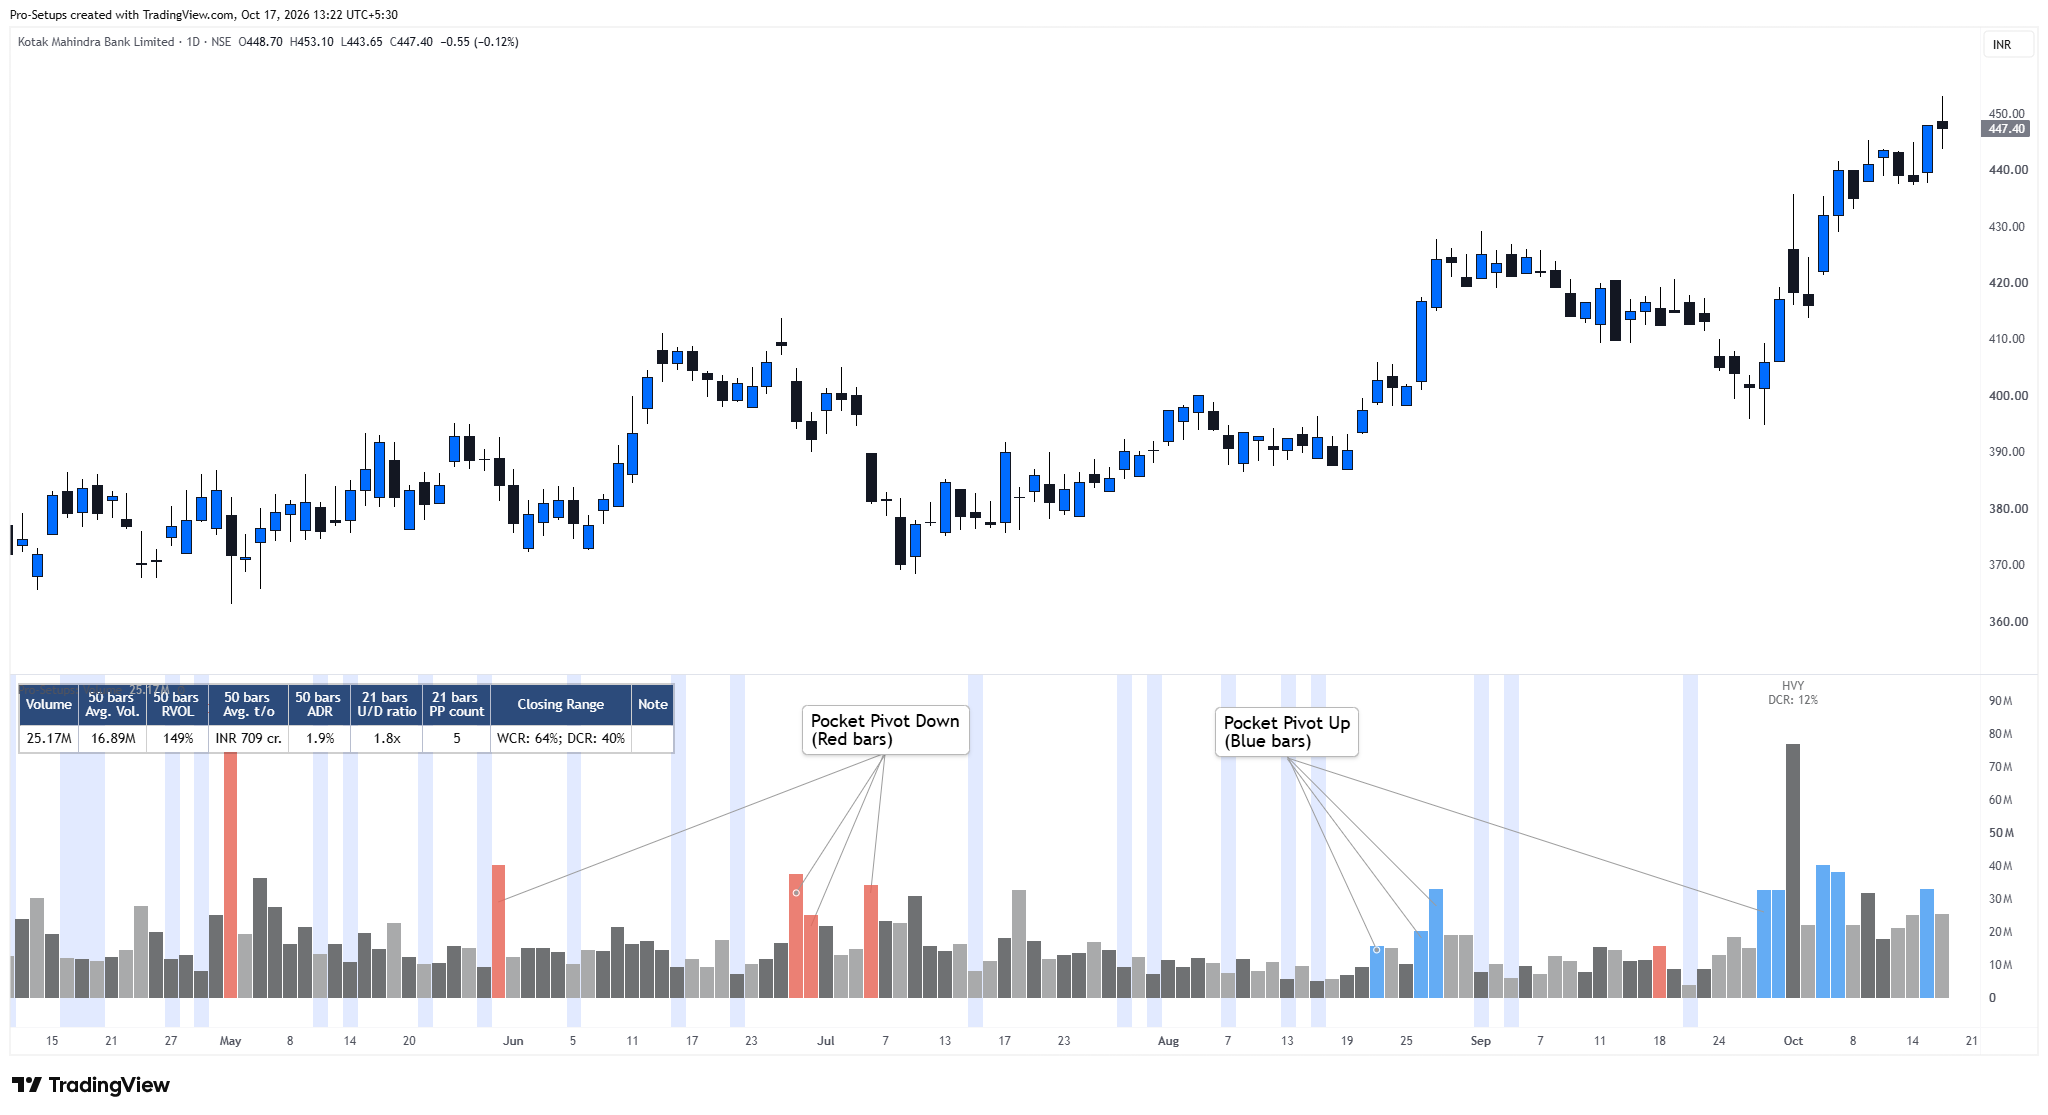
Pocket Pivot Volume is a bullish volume signal that helps traders identify potential institutional buying in a stock, often before it breaks out of a base or consolidation pattern. This concept was introduced and explained by Gil Morales and Dr. Chris Kacher in their book ‘Trade Like an O'Neil Disciple: How We Made Over 18,000% in the Stock Market’.
Pocket Pivot Up – Blue Volume Bar
A Blue Pocket Pivot volume bar is identified when:
- Current volume is greater than the highest volume on Down Bars during the previous selected lookback period.
- Current bar is an Up Bar and Close > Open.
- The candle closes in the upper half of its high-low range (i.e. Closing Range >= 50%).
By default, the indicator compares volume with the previous 10 bars on a Daily chart & lower timeframe and 5 bars on a Weekly chart & above timeframe, though the user has an option to change this value.
Why Pocket Pivot candle is relevant
A Pocket Pivot Up candle may indicate improving buying participation even before a stock gives a conventional breakout. For example, a stock may still be trading within a consolidation, but its upward price movements begin showing Pocket Pivot volume, with volume exceeding the highest Down Bars volume of the previous 10 trading sessions. This may suggest that buying strength is increasing relative to recent selling pressure. Such activity can be useful when studying stocks that are forming a base, moving out of a pullback, or attempting to resume an existing uptrend.
Pocket Pivot Down – Red Volume Bar
Pocket Pivot Down is a bearish variation of the original Pocket Pivot Volume concept developed by Gil Morales and Dr. Chris Kacher. This variation is not part of the methodology described in their book.
The indicator identifies unusually strong volume during downward price movements. A Red Pocket Pivot volume bar is identified when:
- Current volume is greater than the highest volume on Up Bars during the previous selected lookback period (10 bars by default).
- Current bar is a Down Bar and Close < Open.
- The candle closes in the lower half of its high-low range (i.e. Daily Closing Range or DCR <= 50%).
Such a candle may indicate increased selling pressure. These events can be particularly useful when studying stocks approaching important levels, experiencing failed breakouts, or showing signs of weakness. However, a Red Pocket Pivot Volume bar does not necessarily indicate further price declines. Its significance should be assessed alongside the stock’s price structure, prevailing trend, and surrounding volume activity.
Pocket Pivot Count
The Commentary Panel also shows the number of Pocket Pivot Up candles appearing within a selected period. By default, the calculation uses:
- 21 bars on Daily charts (representing a month of trading activity) or lower timeframes.
- 12 bars on Weekly charts (representing a quarter of trading activity) or higher timeframes.
Repeated Pocket Pivot Up candles may be worth monitoring because they indicate multiple sessions of relatively strong upward volume participation.
3. Fresh High Relative Volume (FHV)
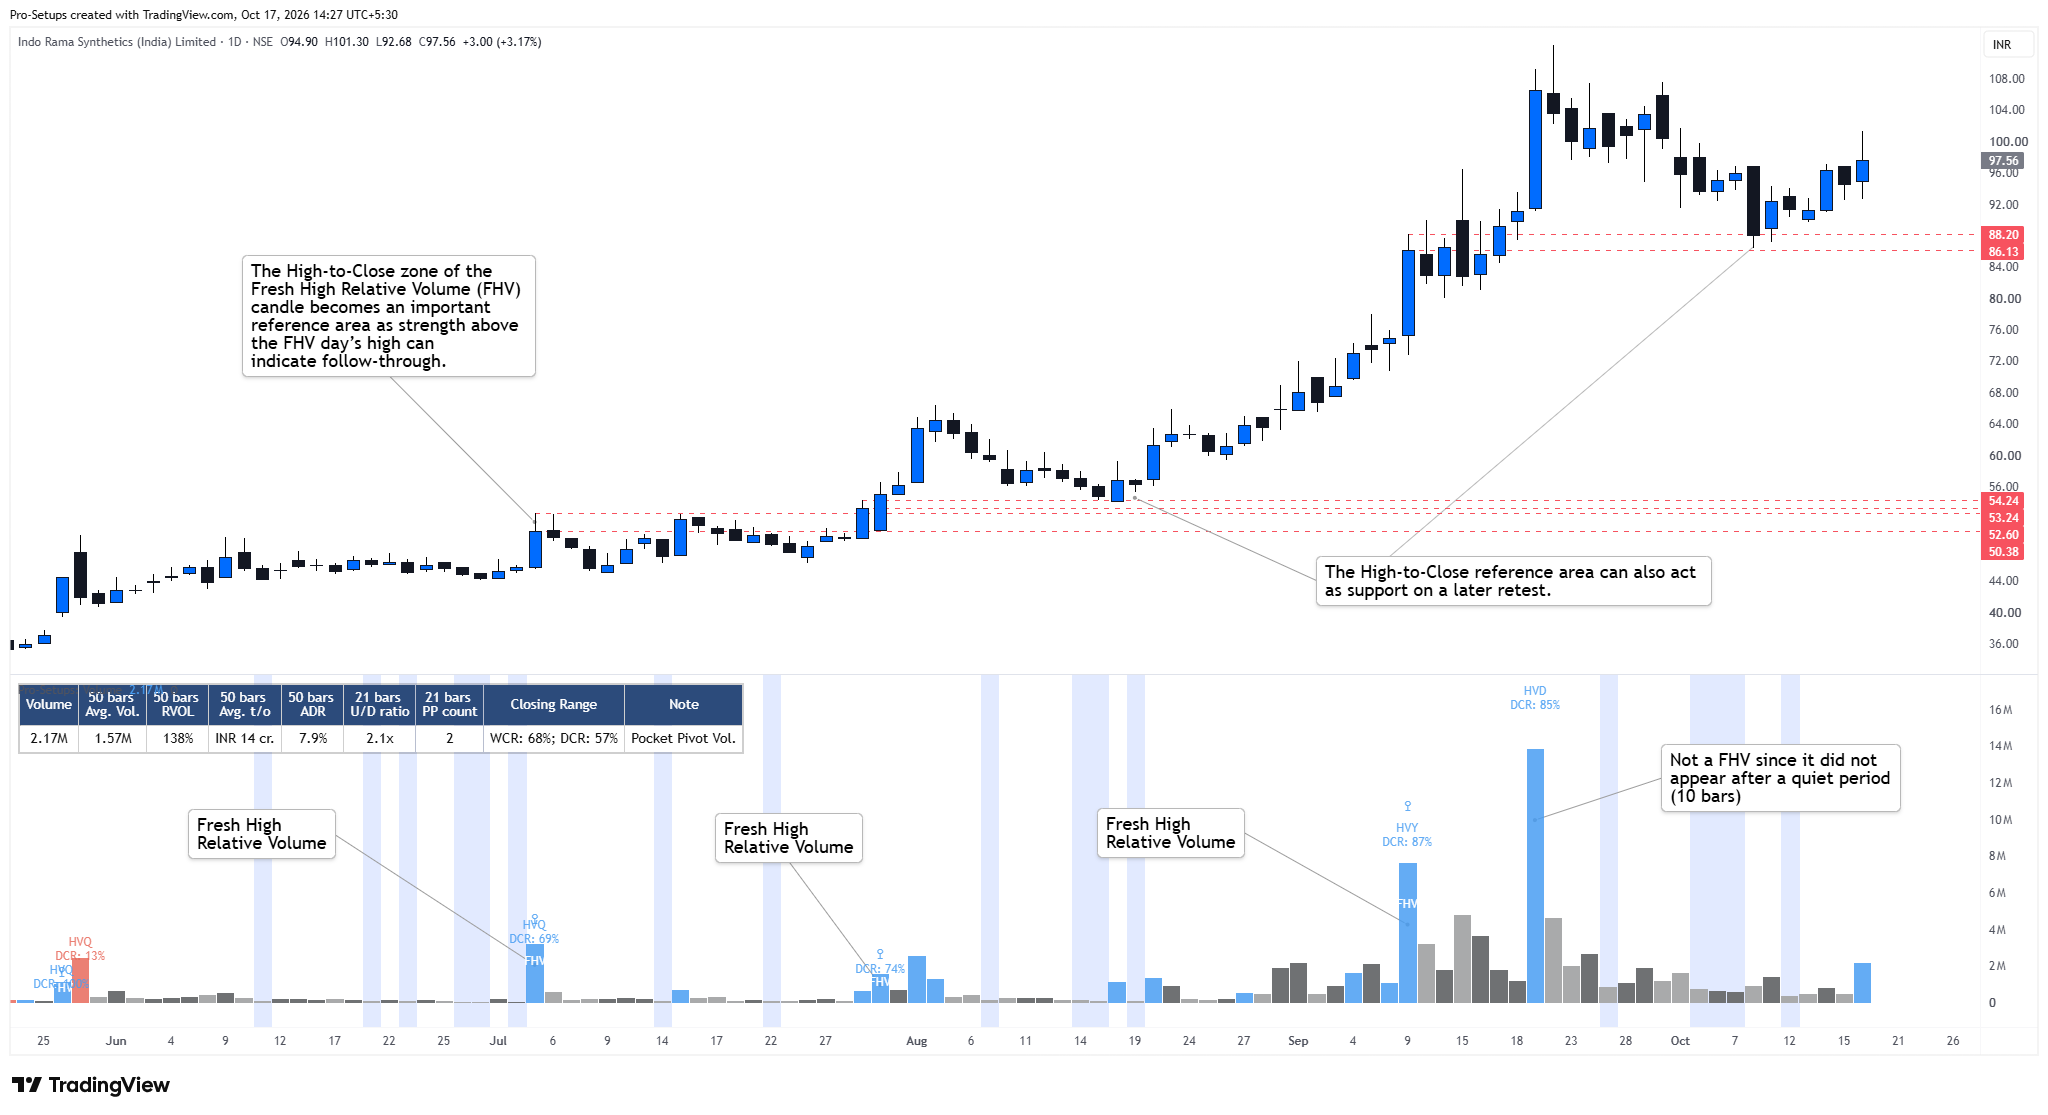
The indicator identifies Fresh High Relative Volume (FHV) events on Daily charts. These are fresh unusually high-volume up days that may indicate strong participation in the stock.
A Daily candle qualifies as FHV when:
- The candle closes above its opening price and closes in the upper half of its daily range (i.e. DCR>=50%).
- Its volume is at least 2 times the highest volume of the previous 10 trading days.
When these conditions are satisfied, the indicator displays a ꔌ icon above the volume candle and an FHV marker on the volume candle.
The indicator also displays the Daily Closing Range (DCR) alongside these labels. A DCR above 70% indicates that the stock closed in the upper 30% of its daily range, suggesting relatively strong buying interest towards the close.
Why FHV is relevant
Fresh High Relative Volume can help traders spot when a stock suddenly attracts much stronger participation than usual, especially after a quieter period. Such a day can put the stock on the watchlist for a possible developing setup. Traders may monitor the high and closing price of the FHV candle as reference levels. Strength above the FHV day's high may indicate follow-through, while the same area can be watched for support during a later retest. FHV is therefore best used as a context and confirmation tool, not as a standalone Buy signal.
4. Highest Volume in Quarter, Year and Decade
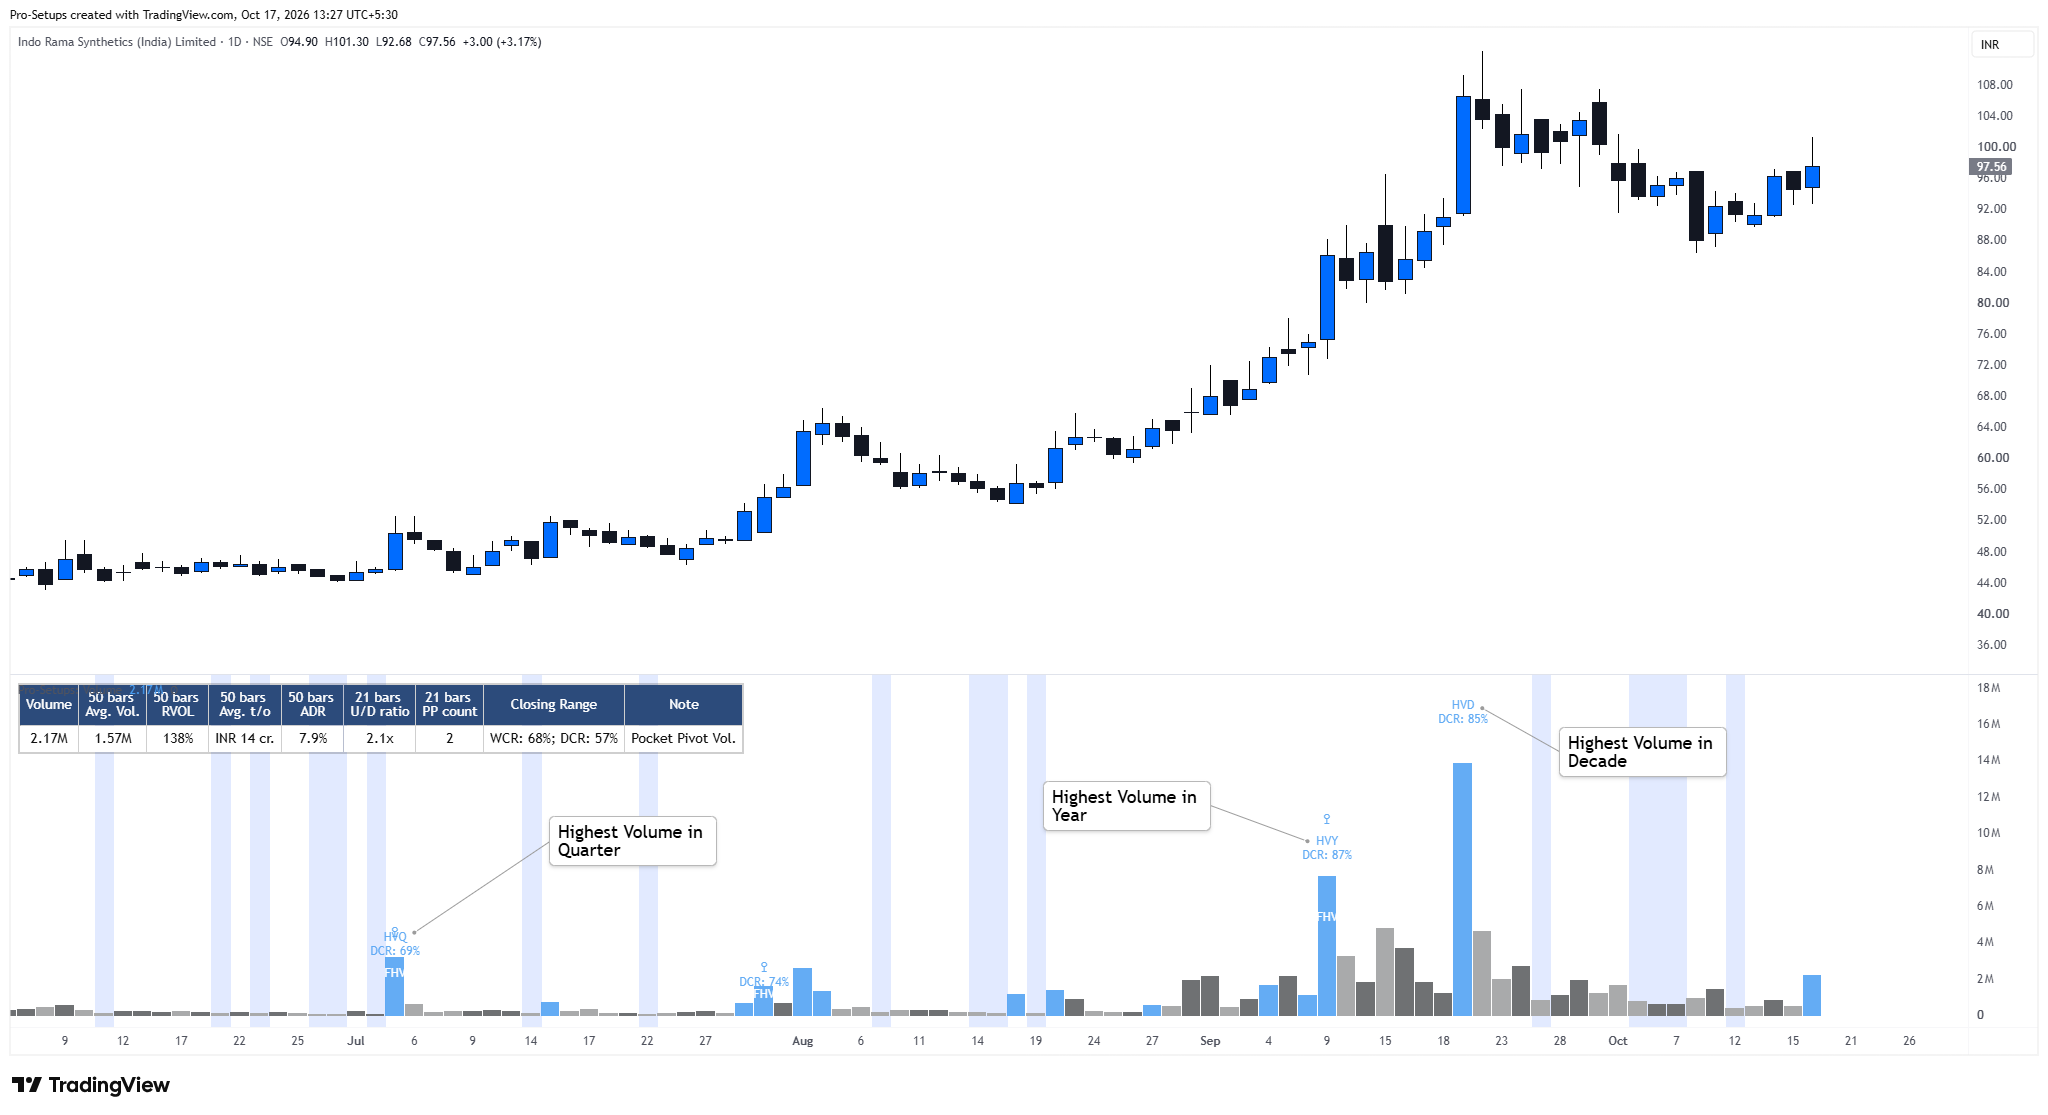
The indicator also highlights sessions when volume reaches a new high relative to longer historical periods. Three categories are used:
- HVQ – Highest Volume in Quarter: Current volume equals or exceeds the highest volume recorded during the previous 63 trading bars.
- HVY – Highest Volume in Year: Current volume equals or exceeds the highest volume recorded during the previous 252 trading bars.
- HVD – Highest Volume in Decade: Current volume equals or exceeds the highest volume recorded during the previous 2,520 trading bars.
These calculations are intended primarily for Daily charts, where the lookback periods approximate one quarter, one year and one decade of trading sessions. If a volume bar qualifies for multiple categories, the indicator displays only the highest applicable category. The indicator also displays the Daily Closing Range (DCR) alongside these labels.
Why are historical volume highs relevant?
An unusually high-volume session may represent an important change in market participation. Such activity can occur during a ‘Pivotal point’, such as a base breakout, following an important company announcement, or during a sharp upward or downward move. For example, a stock breaking out of a long consolidation on its highest volume in one year may be worth closer attention than a similar breakout occurring on ordinary volume.
5. Low Volume Zone – Volume Dry-Up
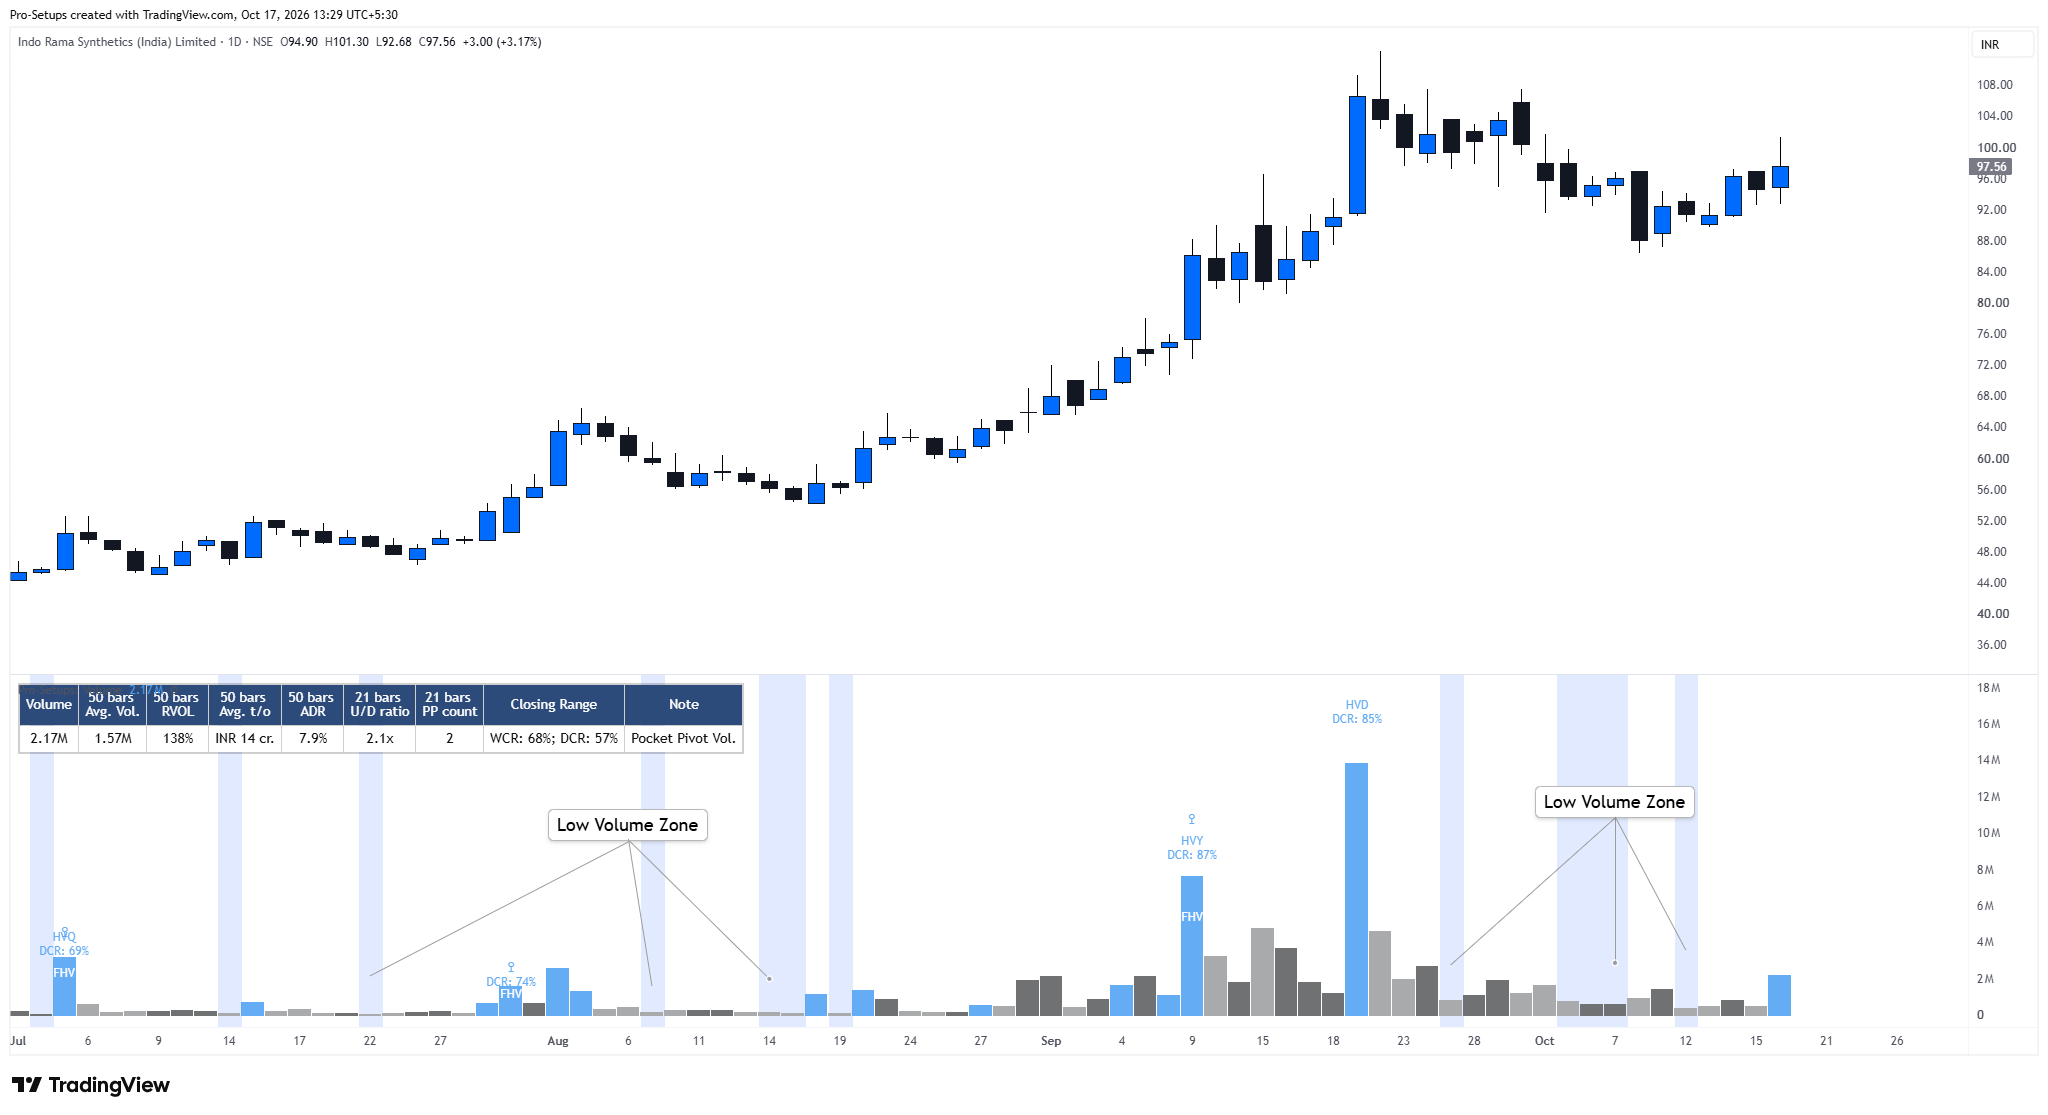
While unusually high volume can indicate strong participation, unusually low volume can also provide useful information. The Low Volume Zone feature highlights periods when trading activity becomes particularly quiet.
A light-blue background appears behind the volume bars when the current volume is the lowest, during the most recent 5 bars and is also below 65% of the average volume over 50 bars.
Why Low Volume Zones are relevant
During a healthy consolidation, volume often contracts as price movements become smaller and trading activity slows, which may indicate that selling activity is becoming quieter. Swing traders often look for such periods of reduced activity while studying stocks developing tight consolidation, constructive pullbacks, or volatility contractions.
However, low volume should always be viewed in the context of price action. It can also occur in illiquid stocks or during periods when there is little investor interest.
6. Average Volume Line
The indicator provides an optional Average Volume Line, which shows the average trading volume over a selected number of bars. By default, it uses 50 bars, but users can change the period and line colour from the settings. This line helps traders quickly see whether the current trading volume is higher or lower than usual.
7. Commentary Panel
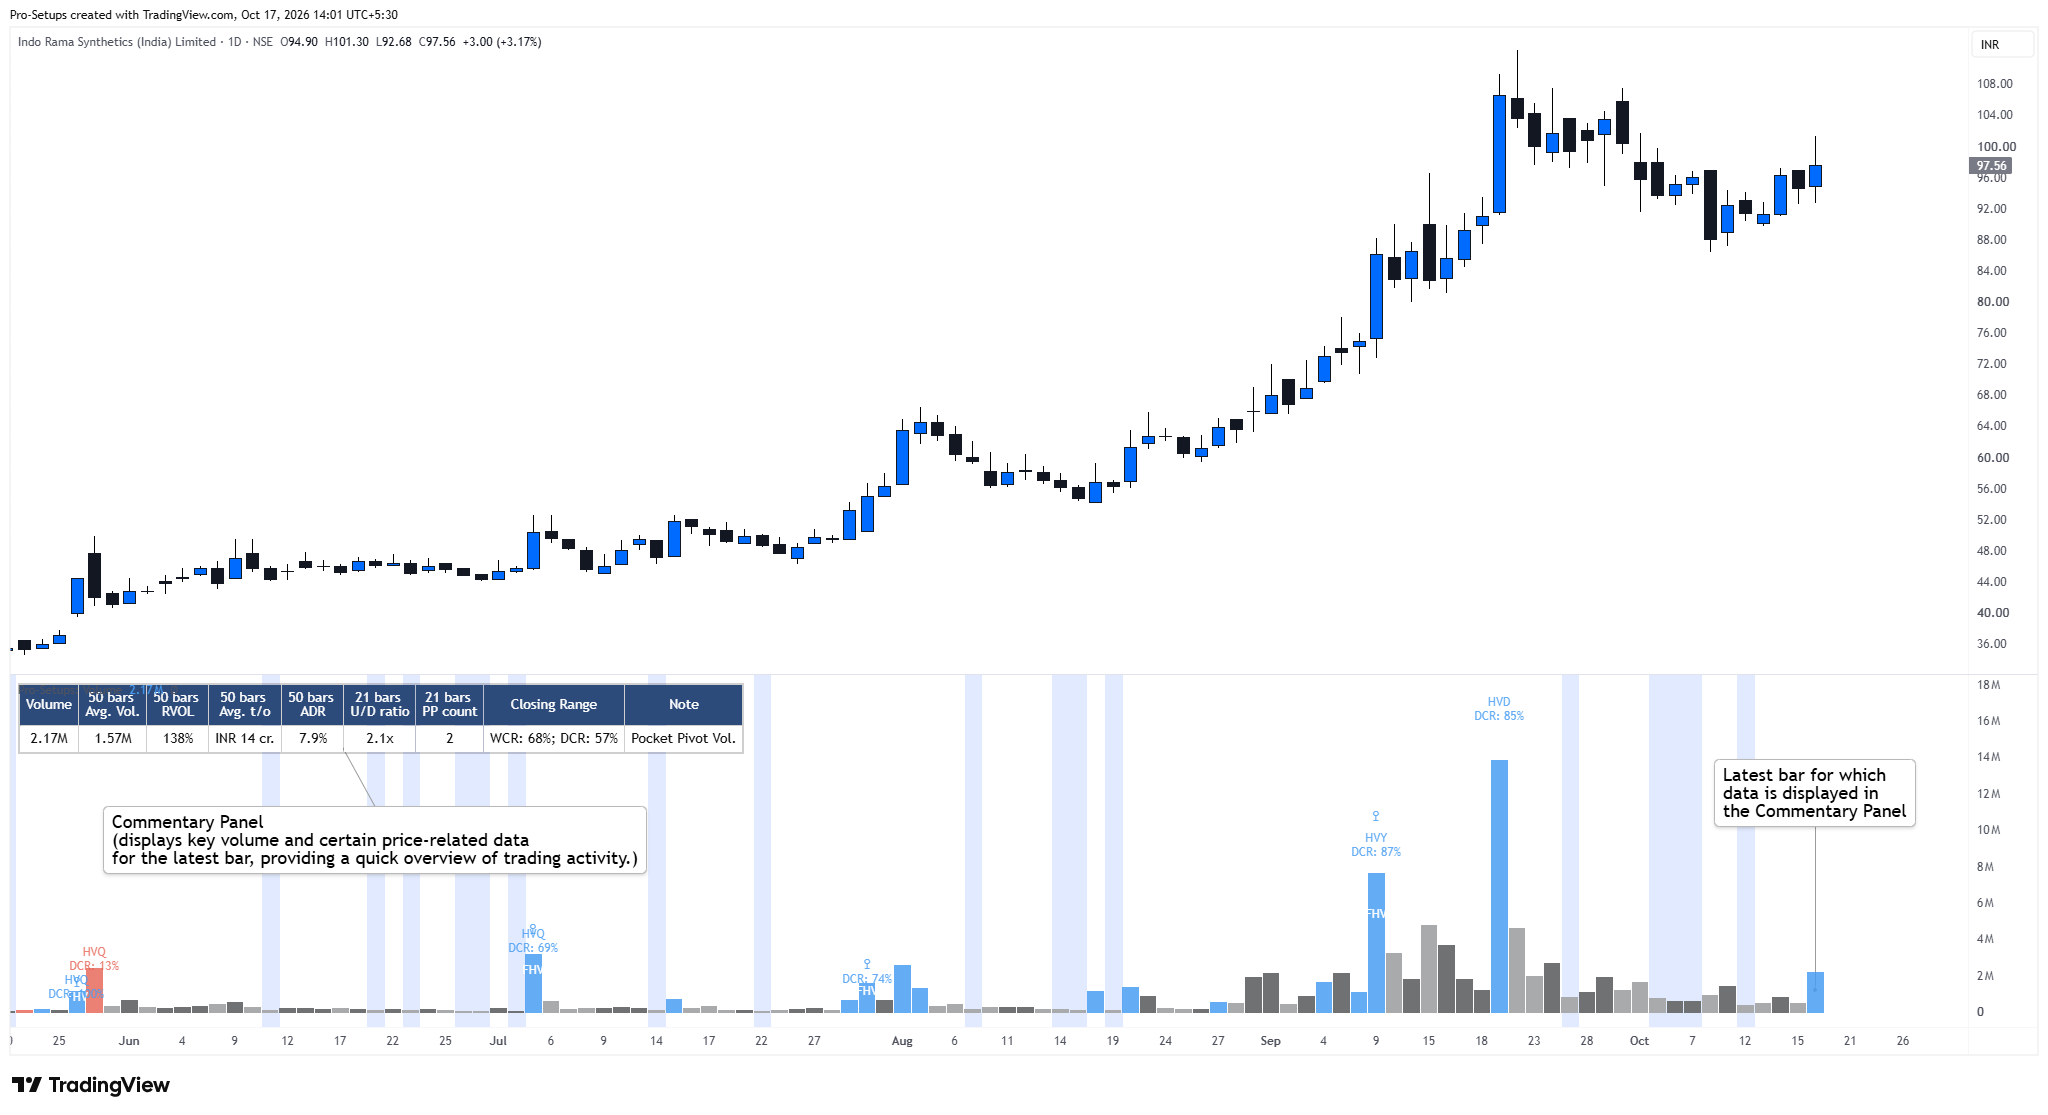
The Commentary Panel displays key volume and certain price-related data for the latest bar, providing a quick overview of trading activity. The panel displays the following information:
a) Volume - Shows the total volume traded during the current bar.
b) Average Volume - Shows the average volume over the selected period, which is 50 bars by default.
c) Relative Volume (RVOL)
RVOL = Current Volume ÷ Average Volume × 100
RVOL compares current volume with its average volume over the selected lookback period (50 bars by default). For example - RVOL of 200% means current volume is twice its average volume over the lookback period.
Higher RVOL indicates unusually strong trading activity. RVOL can be particularly useful when examining breakouts, sharp price movements, or stocks attracting increasing market attention.
d) Average Turnover
Average Turnover = Average of Volume × Closing Price over the selected period (50 bars by default).
It provides an indication of the monetary value of trading activity. It can be helpful for assessing whether a stock has sufficient liquidity for the trader's intended position size. The indicator allows turnover to be displayed in Billions, Millions, Crores or Lakhs.
e) Up/Down Volume Ratio
Up/Down Volume ratio (U/D volume ratio) = Sum of volume on Up Bars ÷ Sum of volume on Down Bars
It checks the interest of buyers vs sellers over a period of time by comparing the total volume traded on Up Bars with the total volume traded on Down Bars over a selected lookback period (by default 21 bars on Daily charts and 12 bars on Weekly charts).
- U/D volume ratio = 1, means that volume on Up and Down bars has been approximately equal.
- U/D volume ratio > 1, means more buyers than sellers and the ratio is bullish. In other words, more volume on the upside than on the downside.
- U/D volume ratio < 1, means more sellers than buyers and the ratio is bearish. In other words, more volume on the downside than on the upside.
A higher U/D volume ratio is considered when a stock is within a valid setup. When a successful breakout has already happened, the U/D volume ratio is bound to be very high.
f) Pocket Pivot Count
Number of Pocket Pivot Up candles appearing within a selected period (by default - last 21 bars on Daily charts or lower timeframes, and 12 bars on Weekly charts or higher timeframes).
g) Average Daily Range (ADR)
ADR (Average Daily Range) is a volatility indicator that measures the movement between a stock's High and Low during a typical trading day, calculated as an average over a specific number of bars. Traders use it to understand a stock’s everyday volatility, which helps them set realistic expectations for profit targets and stop-loss.
For example, an ADR of 4% indicates that the stock's average high-to-low trading range has been approximately 4% over the comparison period. Swing traders generally prefer stocks with high ADR (above 3-4%) since they believe that there is a high probability of these stocks to move faster compared to stocks with lower ADR.
ADR % = (High − Low) ÷ Low × 100
The indicator then calculates the average of these percentage ranges over the selected period (50 bars by default).
h) Daily and Weekly Closing Range (DCR/WCR)
Closing Range measures where a candle closes within its high-low range. It is calculated as:
Closing Range = (Close − Low) ÷ (High − Low) × 100
For example:
- A Closing Range of 90% indicates that price closed near the high of the candle.
- A Closing Range of 50% indicates that price closed around the middle of its range.
- A Closing Range of 10% indicates that price closed near the low.
The indicator displays:
- DCR – Daily Closing Range.
- WCR – Weekly Closing Range.
On a Daily chart, both DCR and WCR are shown, helping traders compare the strength of the current Daily close with the broader Weekly price action.
On a Weekly chart, the panel displays WCR.
Closing Ranges are not displayed on timeframes less than Daily charts.
Traders use this metric to assess end-of-period market control, as a stock closing near the very top of its closing range (90-100% range) signals dominant buying pressure.
Note: For the identification of Pocket Pivot volumes and Fresh High Relative Volume, DCR must be atleast 50%.
i) Note
The final column of the Commentary Panel highlights any notable volume condition detected on the current bar. Depending on the conditions, it may identify Fresh High Relative Volume, Pocket Pivot Volume, Highest Volume in Quarter, Year or Decade and Low Volume Zone. Where multiple conditions occur together, the panel prioritizes the relevant volume event rather than displaying every possible condition.
How to use this indicator
This indicator helps traders understand trading participation by highlighting unusual volume activity through Fresh High Relative Volume (FHV), Pocket Pivot candles and historical volume highs, while Low Volume Zones identify periods of quieter trading.
The Commentary Panel provides additional insights into volume strength, buying and selling participation, and price behaviour.
These features should be used alongside the broader trend, price structure and market conditions, rather than as standalone Buy or Sell signals.
Timeframe Behaviour
The indicator is primarily designed for Daily and Weekly charts. Some calculations and features are available on other timeframes, but several have specific Daily or Weekly interpretations.
- Fresh High Relative Volume labels are displayed on confirmed Daily candles only.
- The Highest Volume in Quarter, Year and Decade labels are also displayed on Daily charts only.
- Pocket Pivot Volume can be analysed on all timeframe, but best used on Daily charts. The default comparison period is 10 bars on Daily & lower timeframe charts and 5 bars on Weekly charts & above.
- The Up/Down Volume Ratio and Pocket Pivot Count use separate default periods of 21 bars for Daily charts and 12 bars for Weekly charts.
- Closing Ranges are not mentioned on timeframe less than Daily charts.
- The commentary panel, volume, low volume zones can also be displayed on additional timeframes, although their interpretations may differ.
Users should therefore expect the most complete and intended behaviour on Daily and Weekly charts.
Repainting and Developing Bars
Volume and price-based calculations may change while the current candle is developing. FHV and Pocket Pivot signals may appear during the trading session and change or disappear before the candle closes.
Similarly, Relative Volume, Closing Range (DCR/WCR), and Commentary Panel readings may change until the relevant Daily or Weekly candle closes.
Traders who want confirmed volume conditions should therefore wait for the relevant candle to close.
Important Limitations
This indicator is an analytical tool, not a trading system, and does not predict future price movements. High-volume signals such as FHV, Pocket Pivot and historical volume highs do not confirm institutional buying or guarantee future price gains. Similarly, Low Volume Zones do not guarantee a subsequent successful breakout, and the Up/Down Volume Ratio does not directly measure actual buying or selling activity. Volume signals should therefore be interpreted alongside price structure, trend, market conditions and proper risk management.
Intended Use
Pro-Setups: Volume is primarily designed as a visual aid to volume-analysis toolkit for swing and positional traders. It helps traders quickly see whether a stock is experiencing unusually strong volume, repeated upward or downward volume participation, declining trading activity, or important historical volume events. These observations can help traders build watchlists, monitor developing setups and identify charts that may deserve closer attention.
The indicator is an analysis tool and does not constitute investment advice or a recommendation to buy or sell any security.
Protected Source Code
Pro-Setups: Volume is published as a Protected TradingView script. Its Pine Script source code is visible only to the author, while any TradingView user can add the indicator to their chart and Favorites and use it for free without requiring permission.
The source is protected because the script contains custom calculations, thresholds and interaction between its relative-volume, Pocket Pivot, historical-volume, volume-contraction and price-action analysis modules. The description above explains how those features work and how they are intended to be used, while the underlying implementation remains protected.